
Fig. 4.
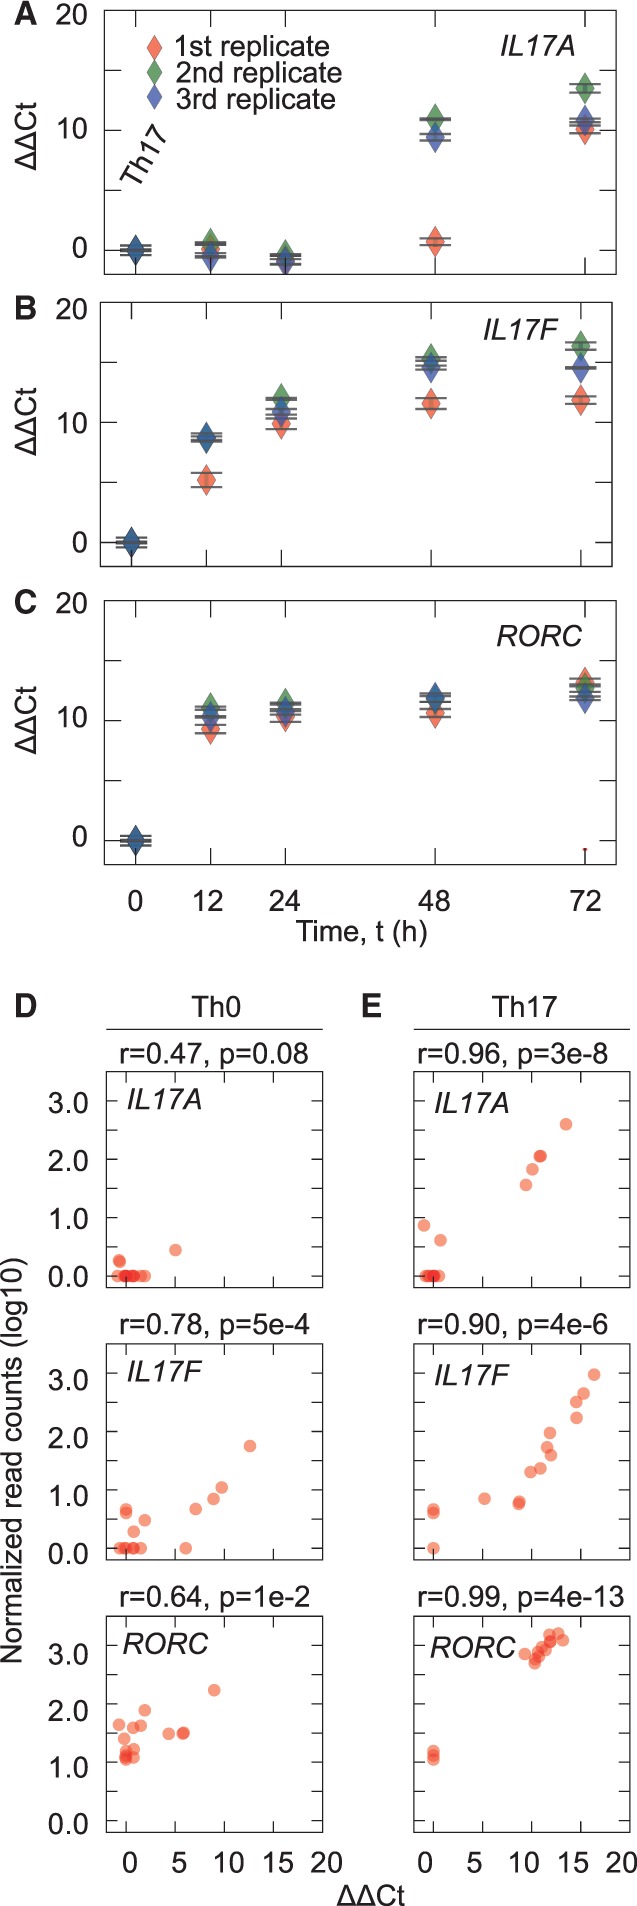
Validation of marker gene expression. (A) qRT-PCR time-series measurements of IL17A mRNA levels in the same samples where RNA-seq was performed. The error bars are depicting the SDs. The colors distinguish the different samples. (B and C) Same as (A) but for IL17F and RORC, respectively. (D) The scatter plots illustrating the replicate-specific correspondence between the qRT-PCR and RNA-seq gene expression estimates of the IL17A (top panel), IL17F (middle panel) and RORC genes (bottom panel) over time in Th0 cells. The correlation is quantified using the Pearson correlation coefficient (r). (E) Same as in (D) but for Th17 cells