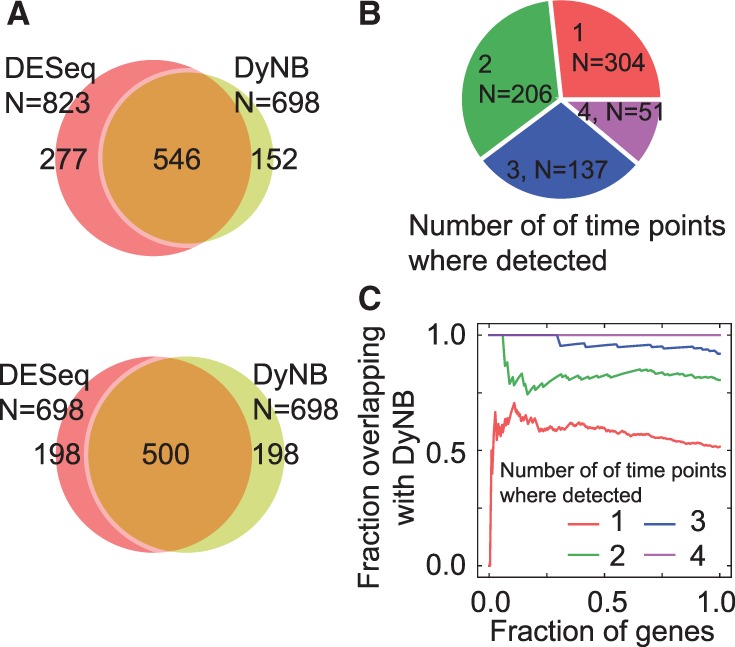
Fig. 6.

A comparison of the results with DESeq. (A) The overlap between the sets of differentially expressed genes identified by DyNB and DESeq (top panel). In the bottom panel we take into account only the top 698 hits from DESeq analysis to make the gene sets equal in size. (B) The number of the top 698 DESeq hits that are found to be differentially expressed exactly at one, two, three or four timepoints in the DESeq analysis. (C) A quantification of how the genes belonging to the classes presented in (B) are found by the presented method using the precision metric. The DESeq hits are taken into account in the order of descending significance (x-axis), which are used to evaluate precisions. For example, precision is one when all the considered genes are found in the set given by DyNB
