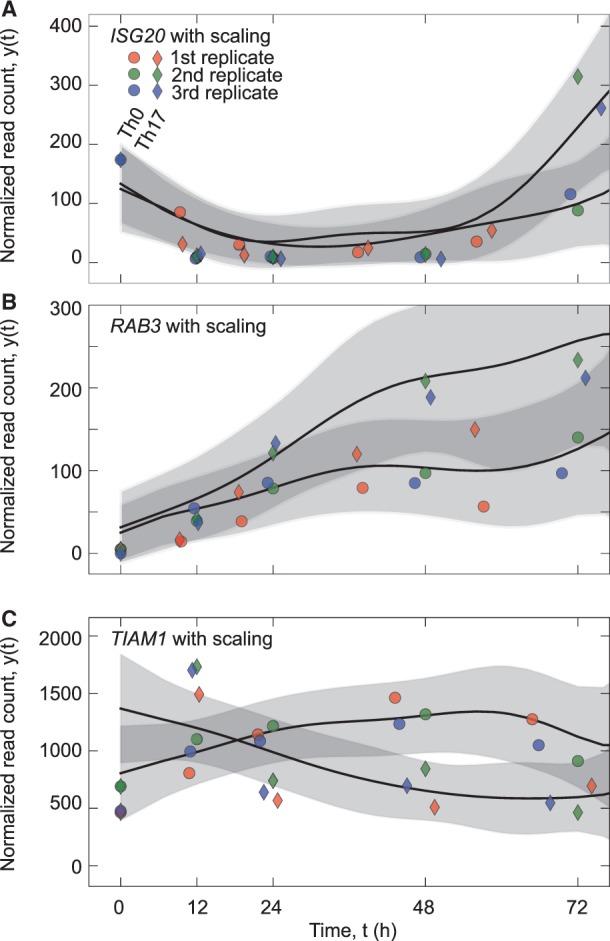
Fig. 7.

Examples of differentially expressed genes detected exclusively by DyNB. (A) The estimated smooth representation of ISG20 dynamics with the time scaling. (B and C) Same as (A), but the depicted results are for the RAB13 and TIAM1 genes

Examples of differentially expressed genes detected exclusively by DyNB. (A) The estimated smooth representation of ISG20 dynamics with the time scaling. (B and C) Same as (A), but the depicted results are for the RAB13 and TIAM1 genes