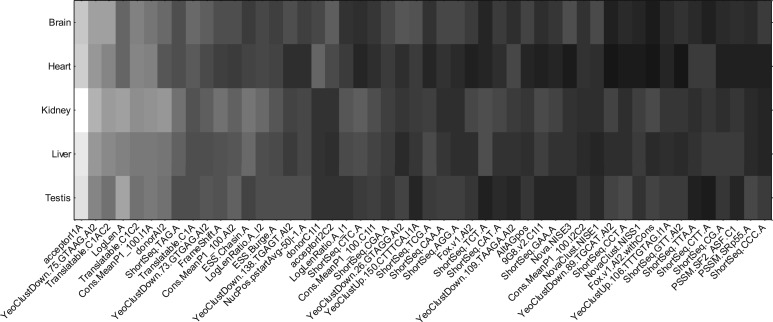
Fig. 3.
Magnitude of the backpropagated signal to the input of the top 50 features computed when the targets are changed from low to high, and high to low. White indicates that the magnitude of the signal is large, meaning that small perturbations to this input can cause large changes to the model's predictions. The features are approximately sorted left to right by the magnitude

