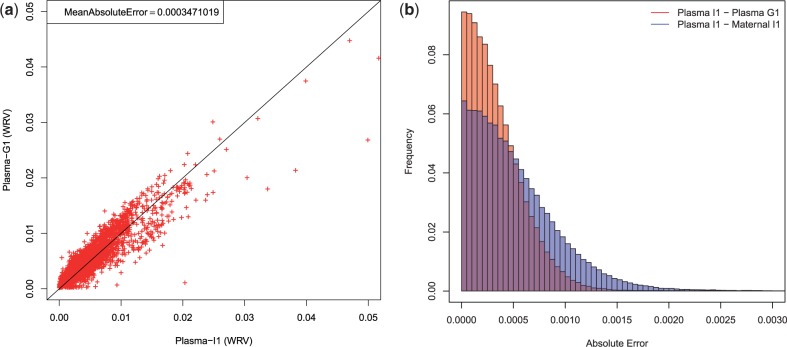
Fig. 2.
(a) A scatterplot demonstrating the correlation of WRV between plasma samples of I1 and G1 trios. The shown WRVs were computed for windows of size 1 kb in chromosome 1. (b) Histogram of absolute errors between WRVs from different samples, comparing distribution of absolute error between plasma samples of I1 and G1 trios (red), and between plasma sample and maternal sample of I1 trio (blue). There is a notably heavier tail in case of plasma to maternal sample error distribution, composed of windows with weak WRV correspondence—an artifact of wider coverage distribution in plasma cfDNA sample compared to standard WGS maternal sample (Fig. 1). This artifact causes plasma to maternal sample WRV comparison to have higher mean absolute error (0.000521, compared with 0.000347 for plasma I1 to plasma G1) even though they are from the same trio

