Fig. 2.

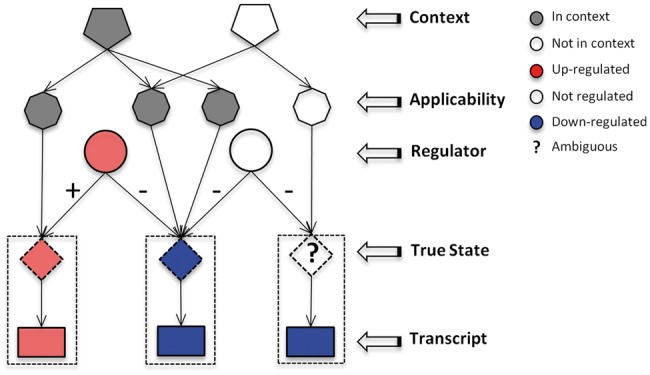
Illustration of the Bayesian Network: for each causal relation, an applicability node is constructed and MeSH terms are used as context nodes. Noise in gene-expression data is accounted for by introducing true state nodes

Illustration of the Bayesian Network: for each causal relation, an applicability node is constructed and MeSH terms are used as context nodes. Noise in gene-expression data is accounted for by introducing true state nodes