Fig. 1.

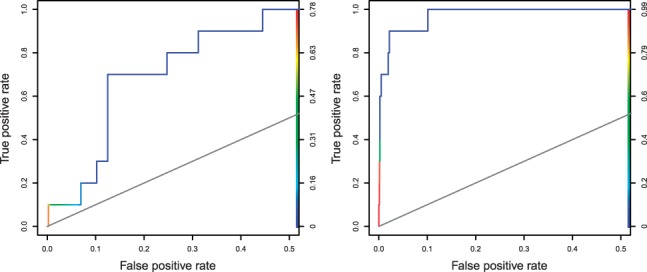
ROC curves (plotted for 0 ≤ sFPR ≤ 0.5) for the E.coli TorR motif discovered by the deterministic EM algorithm (left) and MITSU (right). Curve colour illustrates the threshold of , from highest (red) to lowest (blue)

ROC curves (plotted for 0 ≤ sFPR ≤ 0.5) for the E.coli TorR motif discovered by the deterministic EM algorithm (left) and MITSU (right). Curve colour illustrates the threshold of , from highest (red) to lowest (blue)