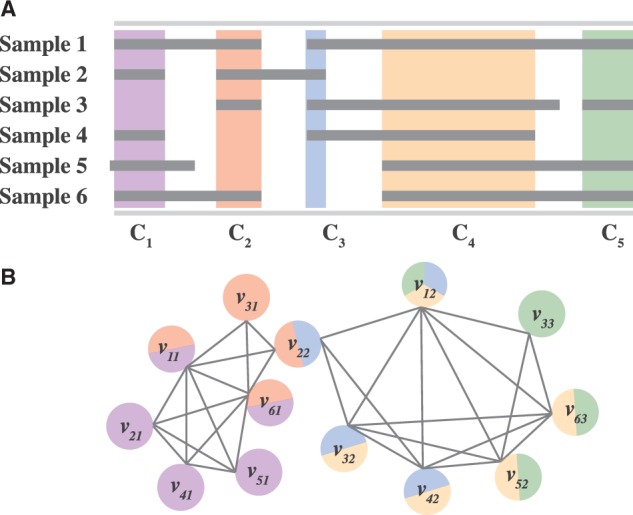
Fig. 2.

(A) SCNAs (gray rectangles) in different samples with regions of common intersections C1,C2, … ,C5 highlighted in different colors. (B) The interval graph formed from SCNAs in (A). Each vertex vij represents the j-th aberration in sample i. Two vertices are connected with an edge if their corresponding aberrations intersect. Vertices are colored according to the common intersections in which the aberration is involved
