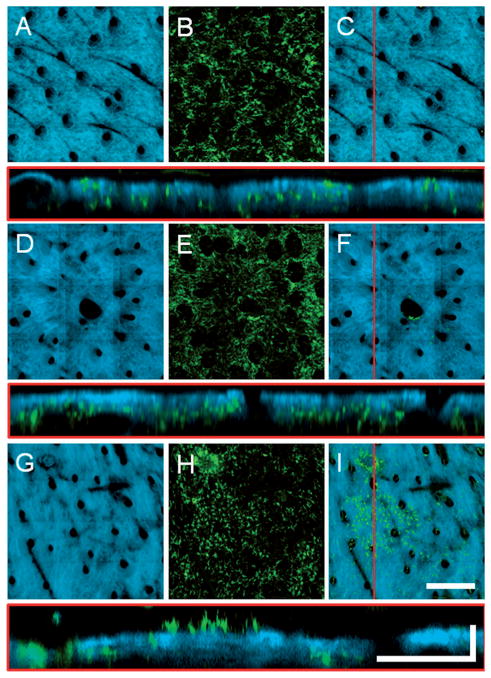
Figure 5.
Axial projections of in vivo volumetric SHG and TPEF images of (A–C) normal, (D–F) wounded, and (H–I) grafted skin in GFP bone-marrow-transplanted mice. (A, D, G) SHG projections visualize the collagen network while (B, E, H) TPEF projections visualize the bone-marrow-derived cells present throughout the depth of the skin. (C, F, I) Overlaid projections with high SHG opacity allowing the GFP cells in the epidermis to be visualized while masking the GFP cells in the dermis (see text for more detail). Cross-sectional images shown below each image set are from the location of the red line in (C, F, I). The presence of a focal cluster of epidermal GFP cells is apparent in the skin graft (I). En face images (A, B, D, E, G, H) are axial projections of volumetric data sets with a depth range of approximately 150 μm into the skin. Scale bar for en face images is 300 μm while the vertical and horizontal scale bars for cross sectional images are 50 μm and 200 μm, respectively.

