
Fig. 1. Representative virtual touch tissue imaging (VTI) for each echogenicity score.
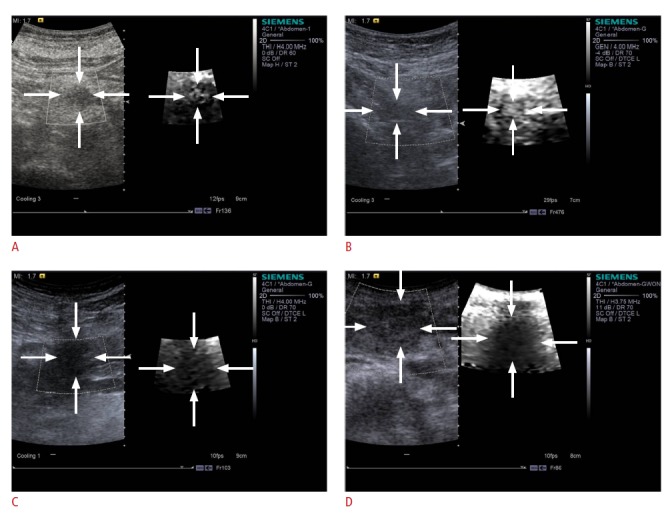
A. On a VTI image, a score 2 lesion appears to have a light gray color. B. On a VTI image, a score 3 lesion has a gray color. C. On a VTI image, a score 4 lesion appears to have a patchy black color. D. On a VTI image, a score 5 lesion appears dark black.