
Figure 1.
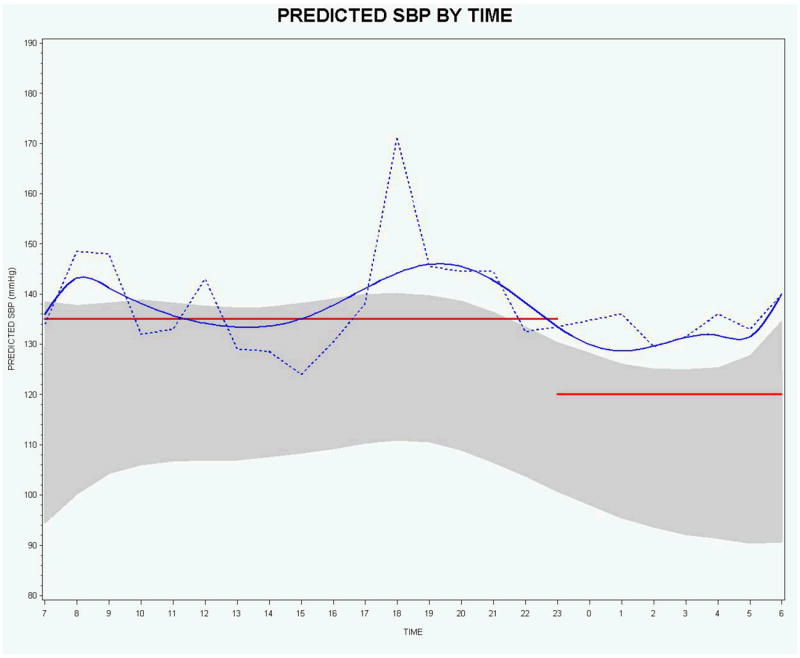
Predicted (blue solid curve) and observed (blue dotted curve) SBP by time for 1 subject with the 90% prediction interval (shaded region) based on normal subjects and commonly used upper normal limit static measures for daytime and nighttime (red horizontal lines).