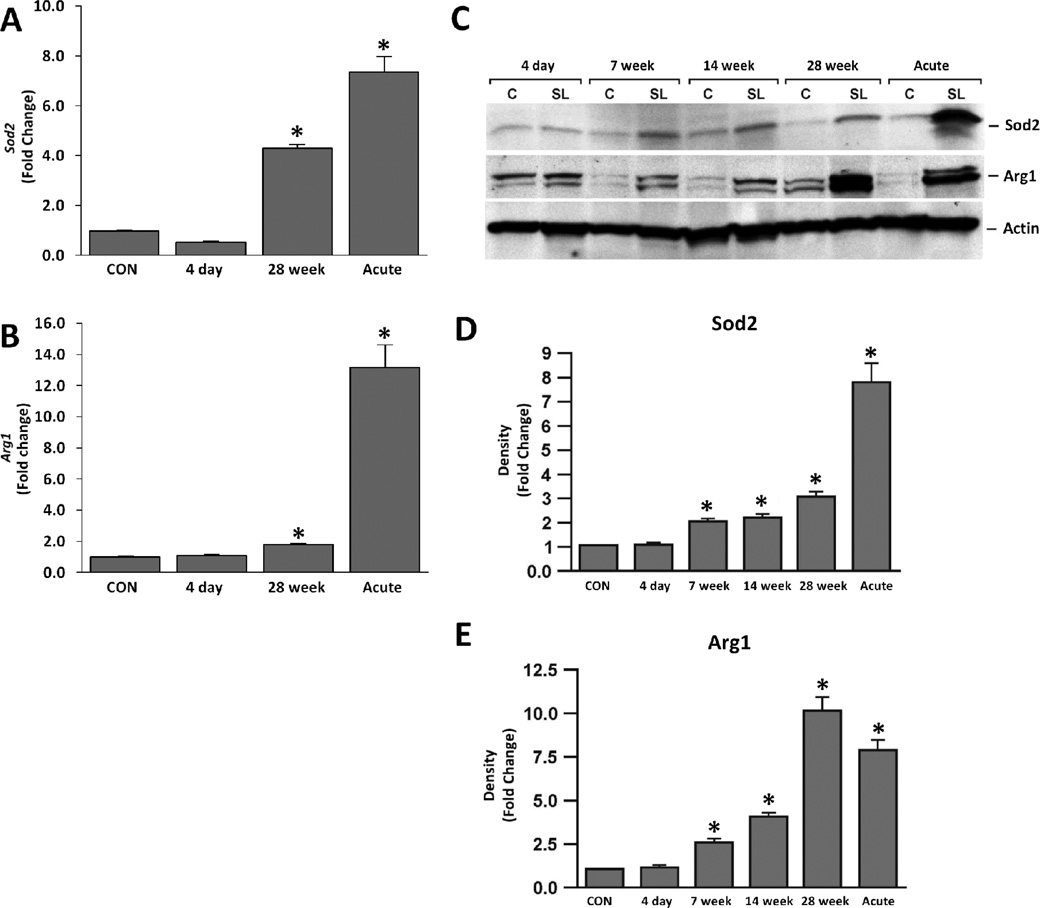
Figure 3. Silica exposure leads to moderate increases in oxidative markers, while acute silica exposure leads to robust changes in oxidative markers.
Changes found in oxidative stress markers (A) Sod2 and (B) Arg1 in sub-chronic silica (4 day and 28 week post-exposure) and acute silica exposures in the whole lung mRNA (qPCR). No significant changes in controls between the various time points were noted (data not shown). Normalization and analysis as described in Figure 1. C). Whole lung lysate Western Blot analysis of oxidative stress markers (Sod2, Arg1) over the time course of sub-chronic and acute silica models for controls (C) and silica (SL). Data are representative of 5 rats per group; β-Actin was used to confirm equal loading. Densitometry analysis of Western Blots for (D) Sod2 and (e) Arg1. Lanes were normalized against the density readings of β-Actin and are presented as fold change as compared to controls. Analysis was determined in 5 rats per group against appropriate time-sensitive controls. * p ≤ 0.05.

