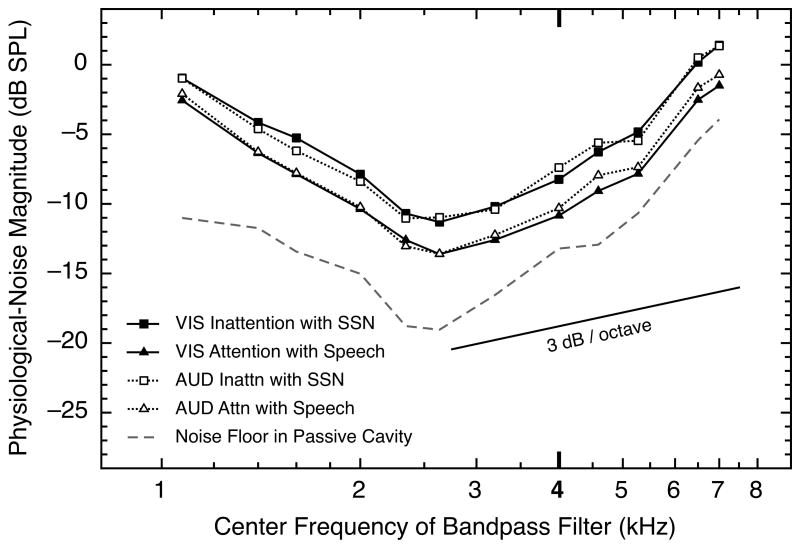
Fig. 3.
Physiological-noise magnitude as a function of frequency for four experimental conditions, all involving distractor sounds. For each data point, each of the seven subjects contributed one mean across the final ten analysis windows during the silent period (10-ms windows with onsets from 10 to 19 ms after stimulus offset), and those values were averaged across four blocks for each subject and then across seven subjects. Two of the means were obtained from blocks of trials from the auditory-attention study (Walsh et al., 2014), and two were obtained in the present study. The same seven subjects contributed to both data sets. The data from the inattention conditions are shown as squares, and the data from the selective-attention conditions are shown as triangles. At each frequency, the physiological-noise waveforms were bandpass filtered using a bandwidth that was 10% of that particular frequency. All final means were corrected for the different rise times of the 10% filters at the different center frequencies. Also shown are estimates of the electronic noise floor of our system across frequency (dashed line). A line with slope of 3 dB per octave is shown; had the increases in magnitude of the physiological noise been attributable solely to bandwidth increases in the analysis filter, the data functions would have had that slope.

