
Figure 1.
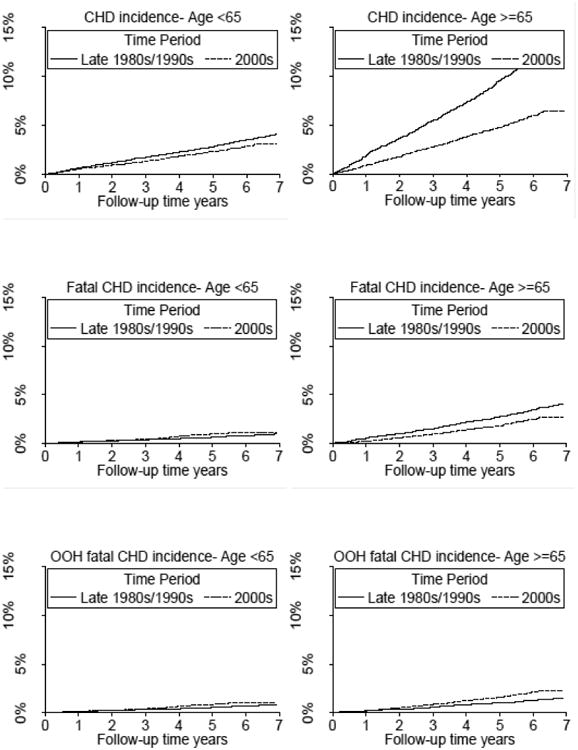
Kaplan-Meier curves for incidence of coronary heart disease (CHD) (top panel), fatal CHD (middle panel), and out-of-hospital (OOH) fatal CHD (bottom panel) for individuals <65 years of age (left panel) and ≥65 years of age (right panel) comparing the 2000s (REasons for Geographic And Racial Differences in Stroke study population) to the late 1980s/1990s (Atherosclerosis Risk In Communities cohort study population and Cardiovascular Health Study population).