Fig. 2.

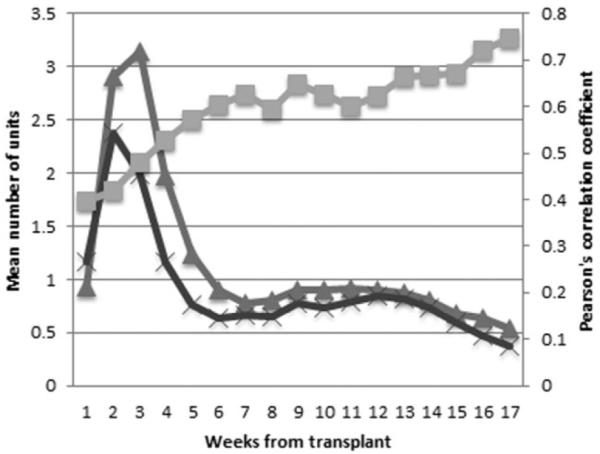
Mean weekly transfusion sums. Mean weekly sums of RBC and PLT transfusions were greatest early after HSCT with increasing correlation throughout observation (range, 0.40–0.75). ( ) Weekly PLT sum; (
 ) weekly RBC sum; (
 ) RBC-PLT correlation.

Mean weekly transfusion sums. Mean weekly sums of RBC and PLT transfusions were greatest early after HSCT with increasing correlation throughout observation (range, 0.40–0.75). ( ) Weekly PLT sum; (
 ) weekly RBC sum; (
 ) RBC-PLT correlation.