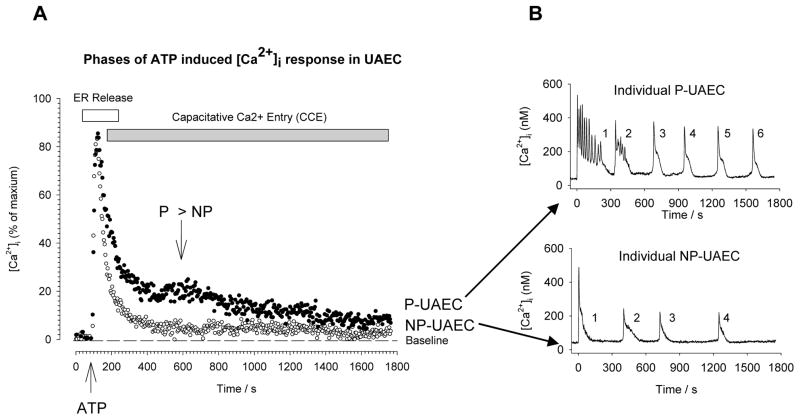
Figure 1. Comparison of grouped average cell response vs individual cell [Ca2+]i response in NP- and P-UAEC.
In all studies cells at high density were loaded with Fura 2 and imaged using the same methodology. In panel A, the results are the combined cell average data from multiple dishes (n=8) with the equipment set to gather data from all cells simultaneously in the entire imaging field (approx. 150 cells). As such this is a reflection of the average combined response and would relate most closely to the overall physiologic activation of NO production experienced by a whole vessel. Note after a broader initial peak in P-UAEC (dark symbols) compared to that in NP-UAEC (open symbols), the sustained CCE phase continues above basal for almost the full remaining 20 minutes, while in NP-UAEC the response falls and remains close to but not quite at baseline. The greatest point of difference in the sustained phase is at approximately 8 minutes after stimulation (agonist added at ~1.5 minutes), as indicated by the arrows. B): An alternative approach is to image individual cells and this reveals clearly that after the initial peak the sustained phase is in fact a series of [Ca2+]i bursts. Since these bursts are both maintained with higher efficiency (more numerous) and occur in more cells in P-UAEC than in NP-UAEC, the average sustained phase CCE response in panel A is greater. The point of greatest differences indicated in panel A occurs simply because the Peak 2 is most likely to occur at that time while the Peaks 3 onward became less and less likely, but still occur more commonly in P-UAEC than in NP-UAEC.

