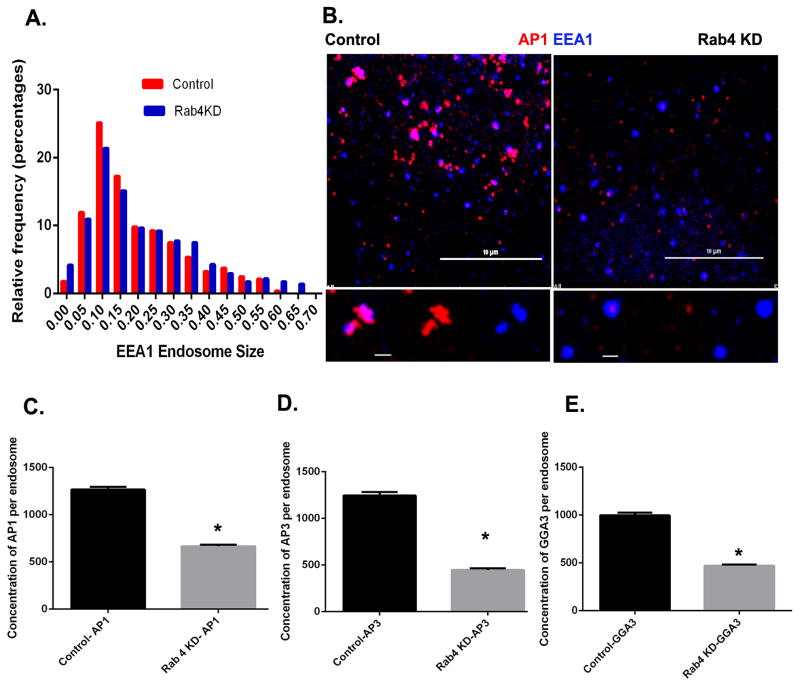
Figure 2. Rab4a/b depletion affects adaptor protein localization to early endosomes.
(A) Endosome size was measured based on endogenous EEA1 staining in control and Rab4a/b depleted Cos7 cells. N for control = 564 and Rab4a/b KD = 1150 endosome respectively. There was no significant change in endosome size. (B) Control and Rab4a/b depleted Cos7 cells were fixed and stained for endogenous EEA1 (blue) and AP-1 (red). Scale bar on upper panel = 10μm and on lower panel = 1μm. (C–E) Quantification of endogenous AP-1 (C), AP-3 (D) and GGA-3 (E) fluorescence on early endosomes in control and Rab4a/b depleted cells. In (C), control, N=1510 and Rab4a/b KD, N=1438 endosomes respectively. In (D), control, N=805 and Rab4a/b KD, N=1068 endosomes respectively. In (E), control, N=861 and Rab4a/b KD, N=985 endosomes respectively. Error bars represent mean±SEM. ‘*’ indicates significantly different at p < 0.0001. Mann Whitney’s test was used to test for significance. See also Figure S1

