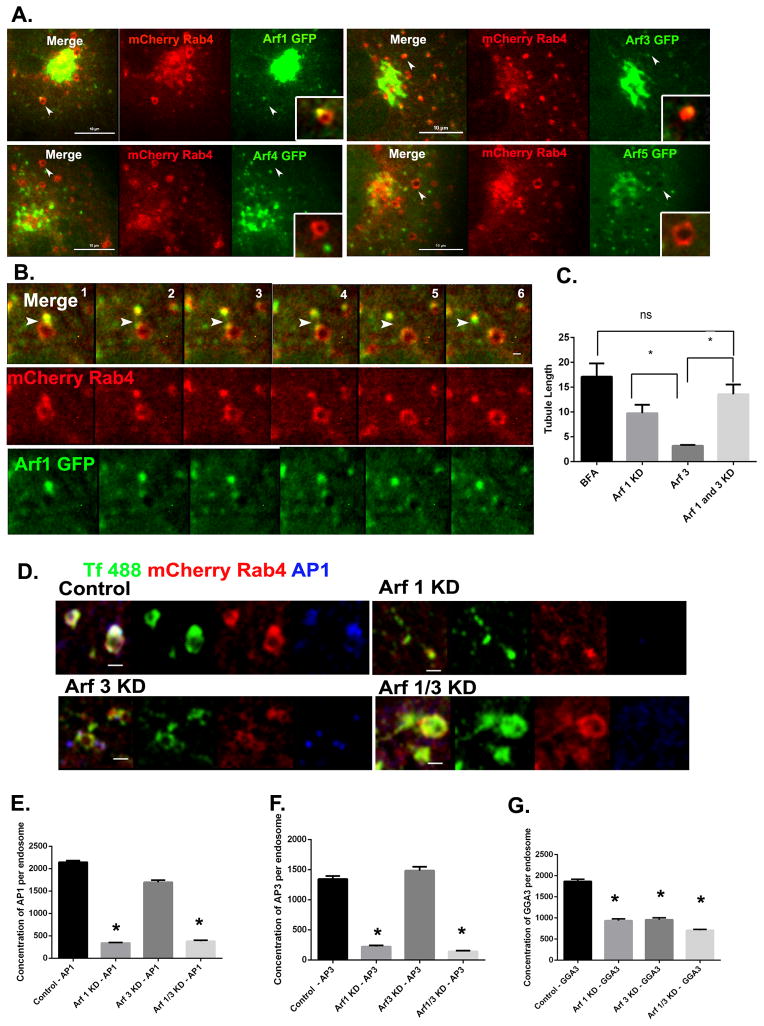
Figure 3. Class I Arfs are required for adaptor protein recruitment to early endosomes.
(A) Still images from live cell videos of Cos7 cells expressing mCherry-Rab4a and Arf1/3/4/5-GFP respectively. Arrowheads indicate presence or absence of Arf (green) proteins on the Rab4a (red) bud. (B) Time lapse series from Movie S2 showing the emergence of a Rab4a-positive bud (red) containing Arf1 (green) as indicated by arrowheads. Scale bar = 1μm. (C) Quantification of endosomal tubule length in Cos7 cells depleted of Arf1/Arf3 singly or in pairs (see also Figure S2A–C) along with BFA treated cells as positive control. Student’s ‘t’ test was used to test for significance (D) Cos7 cells stably expressing mCherry-Rab4a were depleted of Arf1 or Arf3 singly or as a pair, loaded with transferrin (green), then fixed and stained for endogenous AP-1 (blue). Scale bar = 1μm. (E–G) Quantification of AP-1 (E) AP-3 (F) and GGA-3 (G) fluorescence on Rab4-positive buds. In (E), Control, N=649, Arf1 KD, N=982, Arf3 KD, N =518, Arf1/3 KD, N= 316 endosomes respectively. In (F), N for control = 326, Arf1 KD = 676 Arf3 KD = 330, Arf1/3 KD = 685 endosomes respectively. In (G), Control, N=356, Arf1 KD, N=198, Arf3 KD, N=311, Arf1/3KD, N=408 endosomes respectively. Unless specified, Mann Whitney’s test was used to test for significance. Error bars represent mean±SEM. ‘*’ indicates significantly different with respect to control at p < 0.0001. See also Figure S2A–D and Movie S2.

