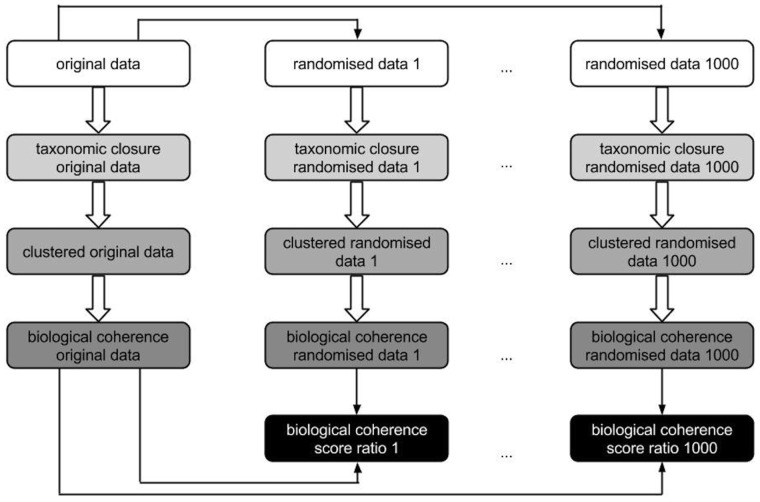
Fig. 2.
Illustration of the calculation of biological coherence scores to evaluate secondary phenotype predictions. Boxes that possess the same background colour are based on the same analysis scripts, only the input data differ (either randomized or original data). Black boxes symbolize the ratio of the biological coherence original versus randomized data which are used as input for the box plots depicted in Figure 3

