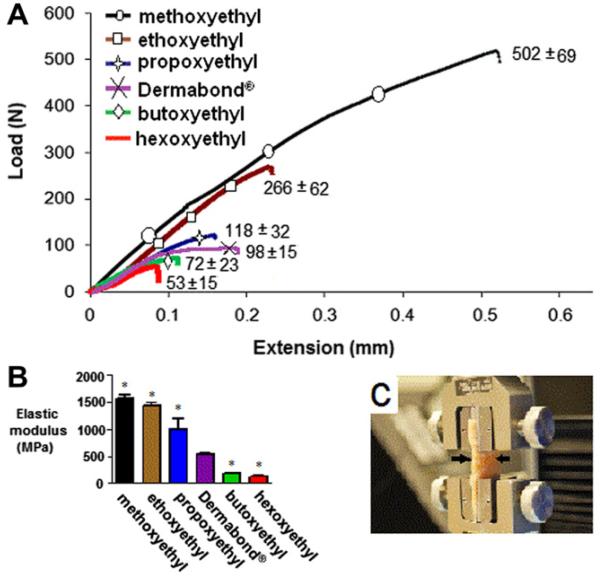
Fig. 4.
(A) Adhesive strength (maximal load at rupture) of CAs with various alkoxyethyl side-chains (n = 8). These are representative curves; the standard deviation of the maximal load (at rupture) is in parentheses (n = 8). (B) The decrease in modulus due to the increase in alkoxyethyl side-chain length. Asterisks denote statistically significant differences from Dermabond®. *P < 0.01. (C) Skin sample prepared for testing in Instron grips (n = 5). Arrows show the site of the glued incision. All data are means with standard deviations.

