Figure 2.

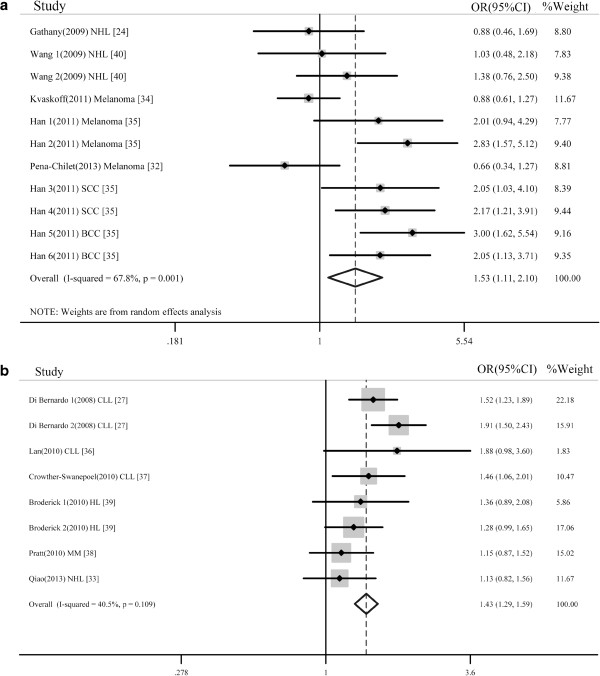
Forest plots of ORs with 95% CIs for IRF4 polymorphisms and cancer susceptibility in the recessive model. (a). rs12203592, TT versus CT + CC. (b). rs872071, GG versus GA+AA.

Forest plots of ORs with 95% CIs for IRF4 polymorphisms and cancer susceptibility in the recessive model. (a). rs12203592, TT versus CT + CC. (b). rs872071, GG versus GA+AA.