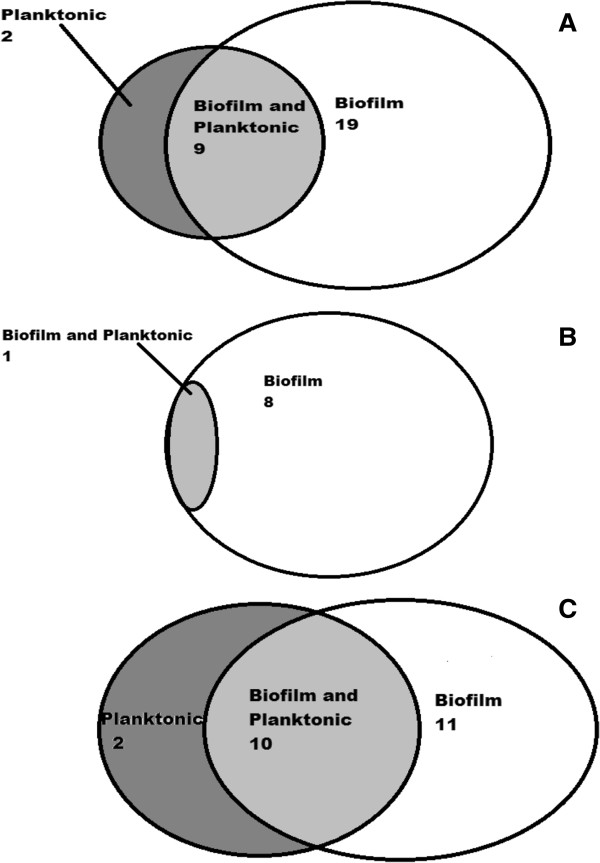
Figure 2.

Venn diagrams representing the number of genes that were altered in HEKa cells exposed to BCM (on the right), PCM (on the left), or shared genes (in the middle). The Venn diagram (A) represents genes associated with inflammation, (B) represents genes associated with NO production, and (C) represents genes associated with apoptosis.
