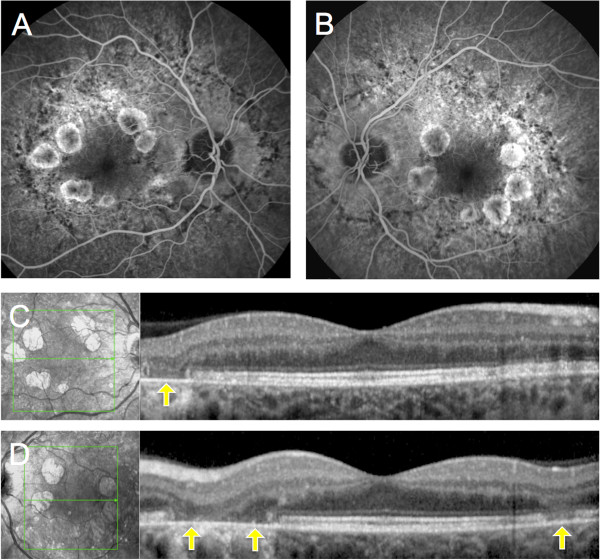
Figure 5.

Fluorescein angiography and SD-OCT of Patient 2. A, B, Fluorescein angiography of the patient 2, showed window defects in the area of the atrophy and a blocking effect by the pale deposits. C, D, On horizontal OCT scans taken through the planes indicated by the green arrows, the outer retina was markedly attenuated in the zones of chorioretinal atrophy (yellow arrows).
