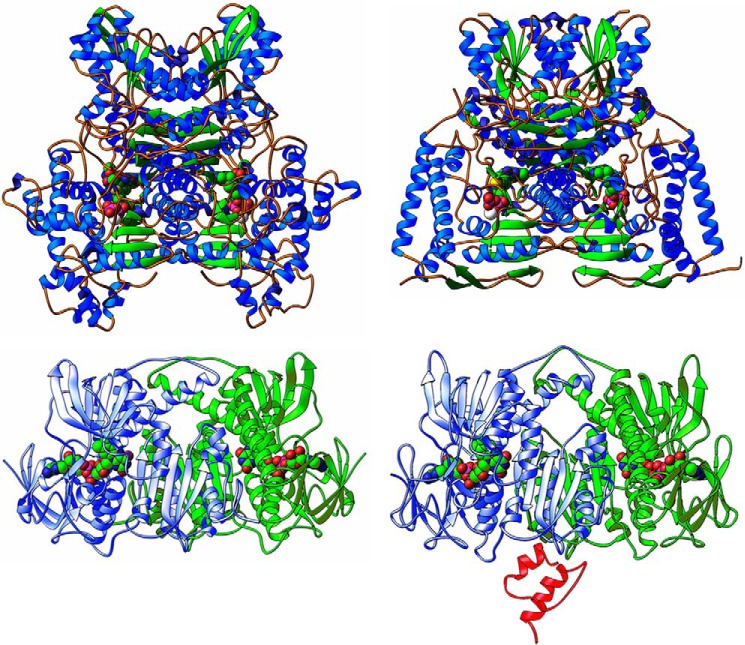
FIGURE 2.
Crystal structures of E1 and E3 from E. coli and human. Top, ribbon diagrams illustrating structural differences between functional homodimeric and heterotetrameric E1 enzymatic assemblies from bacterial (E. coli), and mammalian (human) sources, respectively. Left, the homodimeric assembly from E. coli (reproduced from Ref. 34 with permission, Protein Data Bank (PDB) code 1L8A). Right, the heterotetrameric assembly from human (modified from Ciszak et al. (Ref. 31, PDB code 1NI4). The two figures are on the same scale and shown in the same orientation after least squares alignment based on the cofactors (ThDP) and structurally matching α carbons. The ThDP cofactors are shown in a space-filling representation. Bottom, ribbon diagrams illustrating structures of E3 functional dimers from bacterial E3ec (left) and human E3h (right) sources. In both the left and the right figures, one of the subunits is shown in blue and the other is shown in green, whereas the FAD cofactors are shown in a space-filling representation. The structure of the E3h dimer is shown in subcomplex with the E3-binding domain of E3 (in red). The bottom of this figure is reproduced from Ref. 39 for E3ec (PDB code: 4JDR) and from Ref. 33 for E3h (PDB code: 1ZY8).

