FIGURE 3.
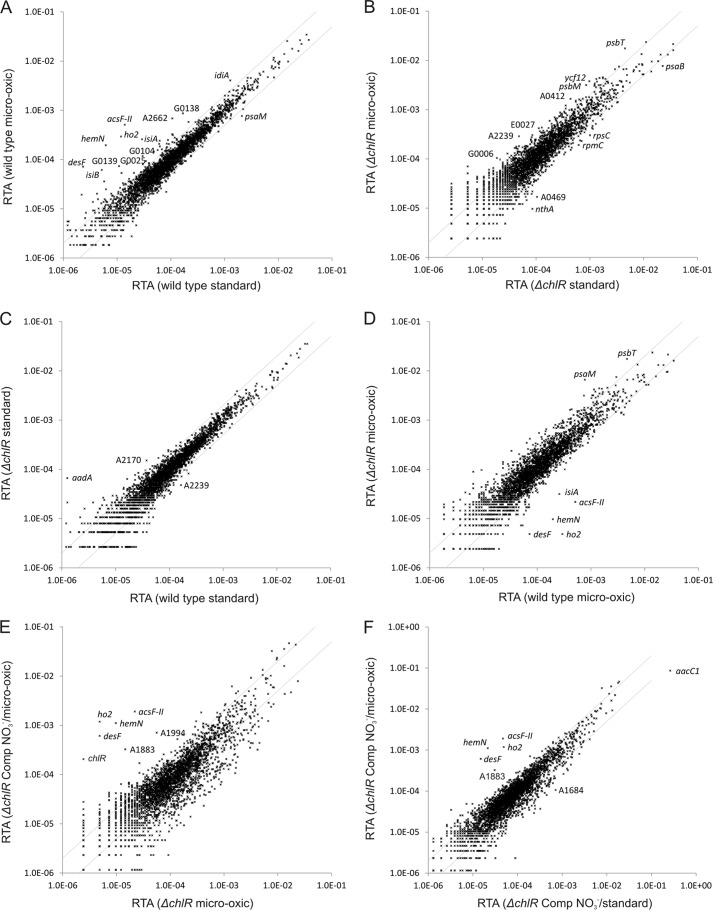
Changes in the RTA of wild-type Synechococcus 7002, ΔchlR mutant, and this mutant complemented with chlR under standard or microoxic conditions. The scatter plots show the RTAs of transcripts from wild-type cells grown under microoxic conditions compared with cells grown under atmospheric O2 (A), the RTAs for cells of the ΔchlR mutant grown under microoxic conditions compared with those for cells grown under atmospheric O2 (B). C, scatter plot showing the RTAs of cells of the ΔchlR strain compared with those for the wild type when both strains were cultivated under atmospheric O2. D, scatter plot showing the RTAs for cells of the ΔchlR mutant compared with those of the wild type when cultures were grown under microoxic conditions. E, scatter plot showing the RTAs of cells for the complemented ΔchlR mutant under derepression conditions (using NO3− as the nitrogen source) to allow expression of chlR compared with the RTA values for the ΔchlR mutant (both strains were grown under microoxic conditions). F, scatter plot showing a comparison of the complemented ΔchlR mutant under derepression conditions (using NO3− as the nitrogen source) when grown under microoxic conditions compared with the same cells grown under atmospheric O2. The values for the wild type under standard conditions (i.e. atmospheric O2 levels) were calculated as the mean of three independent biological replicates. The gray lines show 2-fold changes in either direction. Selected genes are identified by gene locus or abbreviated locus tag number (e.g. A2662 represents SynPCC7002_A2662). Comp, chlR-complemented strain.

