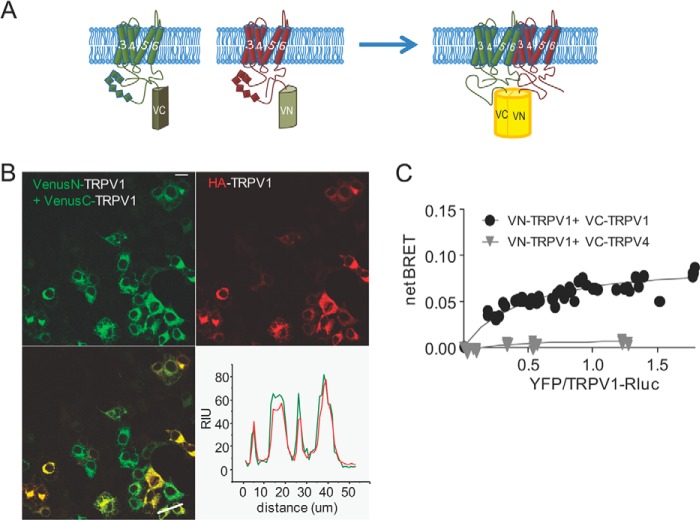
FIGURE 1.
Measure of TRPV1 subunits interaction by BiFC and BRET-BiFC. A, schematic representation of the hemi-Venus proteins (N and C moieties) fused to the N terminus of TRPV1. A functional Venus molecule is formed by protein complementation, resulting from TRPV1 subunit association. B, representative image of tsA-201 cells co-transfected with VenusN-TRPV1 + VenusC-TRPV1 and HA-TRPV1. Note the YFP signal that results from VenusN-TRPV1 and VenusC-TRPV1 association and fluorescence complementation. Lower right, line scan analysis of VenusN-TRPV1 + VenusC-TRPV1 (green) co-transfected with HA-TRPV1 (red) shows overlap of fluorescent signal. Scale bar = 10 μm. RIU = relative intensity units. C, BRET-BiFC titration curve from tsA-201 cells co-transfected with increasing amounts of [VenusN-TRPV1 + VenusC-TRPV1] or [VenusN-TRPV1 + VenusC-TRPV4] and a constant amount of TRPV1-RLuc as the energy donor. Saturation of the BRET-BiFC curve indicates specific TRPV1 interaction, whereas the low linear BRET-BiFC signal denoted the absence of TRPV1 interaction with the TRPV4 channel. Data from three experiments are included in the graph.

