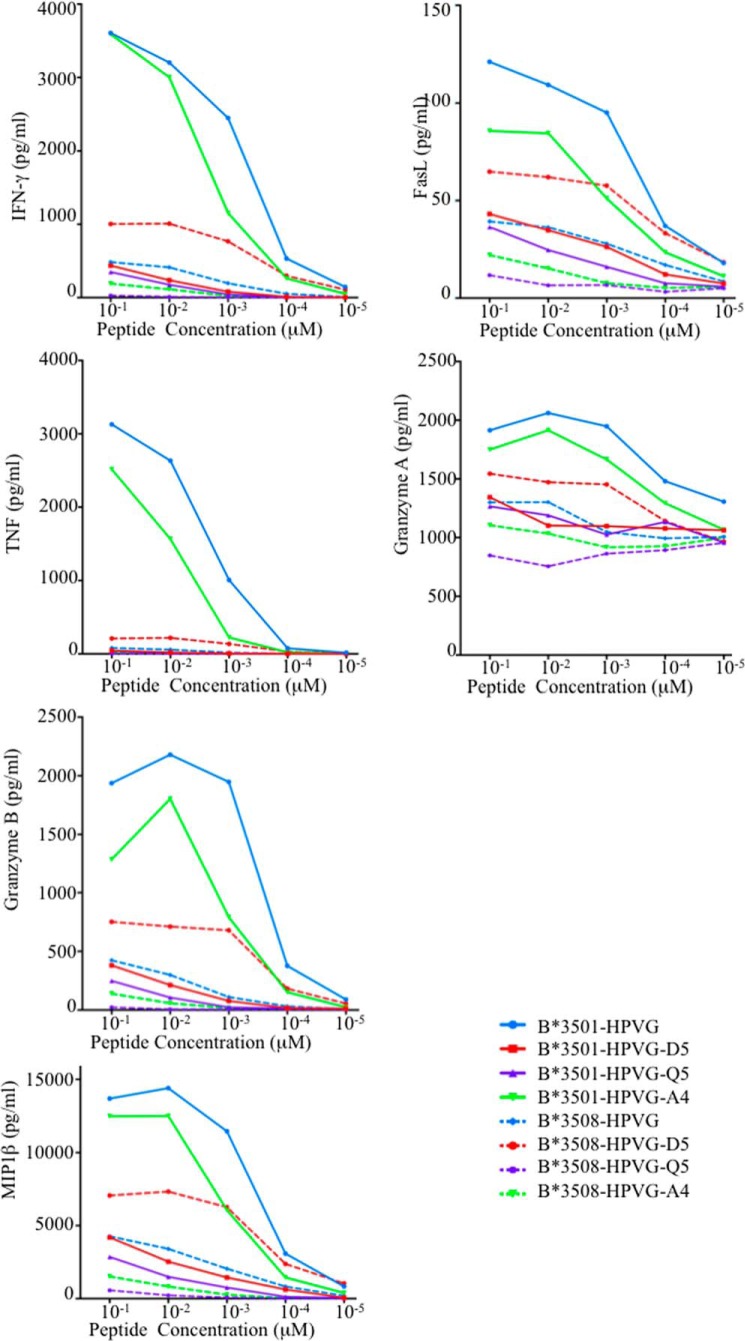
FIGURE 2.
Analyte production by TK3. Analytes released by TK3 after stimulation with HPVG peptide or one of its three variants, presented by T2-HLA-B*35:01 (solid lines) or T2-HLA-B*35:08 APCs (dashed lines) are shown. The culture supernatants of stimulated TK3 cells were assessed by CBA and analyte production in response to HPVG (blue), HPVG-A4 (green), HPVG-D5 (red), and HPVG-Q5 (purple) stimulation at a range of peptide concentrations is shown.

