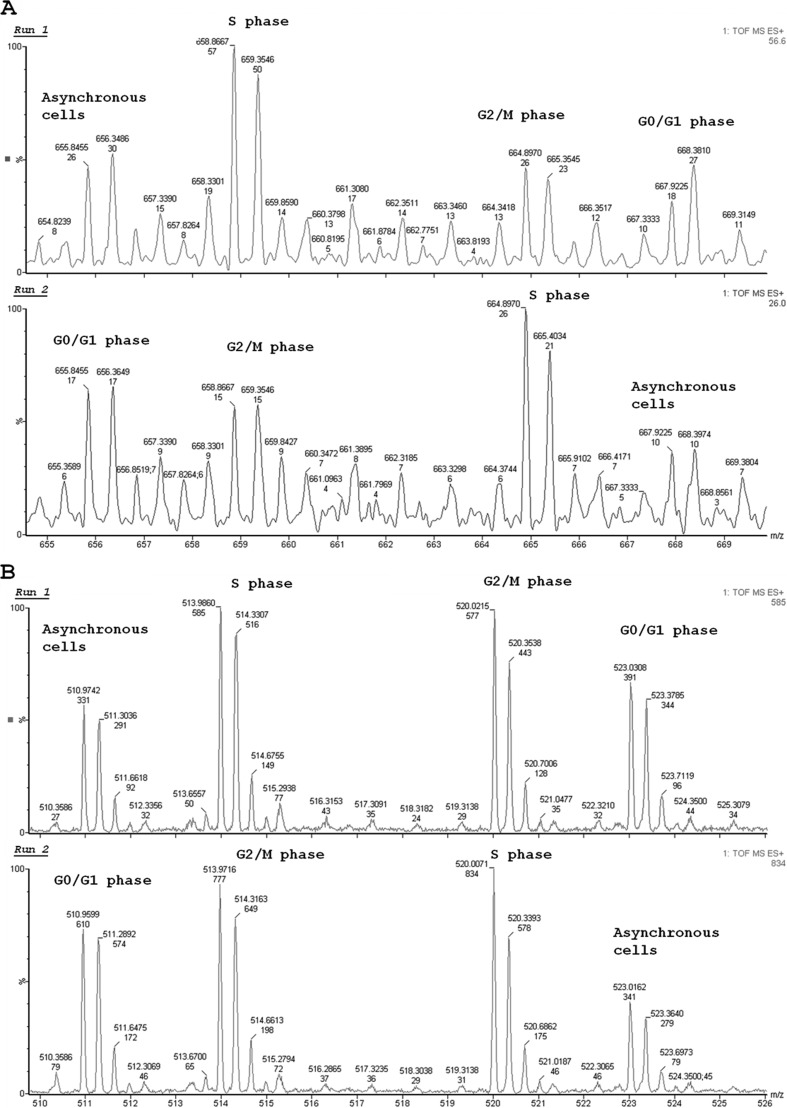
FIGURE 2.
MS spectra representing the semiquantitative analysis of peptides from synchronized HeLa cell extracts (S, G2/M, and G1) or controls. HeLa cells were synchronized with 2 mm thymidine, and the peptides were labeled with isotopes TMAB (D0, D3, D9, and D12). A and B, representative MS spectra of two peptides (pep5 and pep3) that reproducibly changed during the HeLa cell cycle. The data shown here are representative of two independent experiments.

