
FIGURE 8.
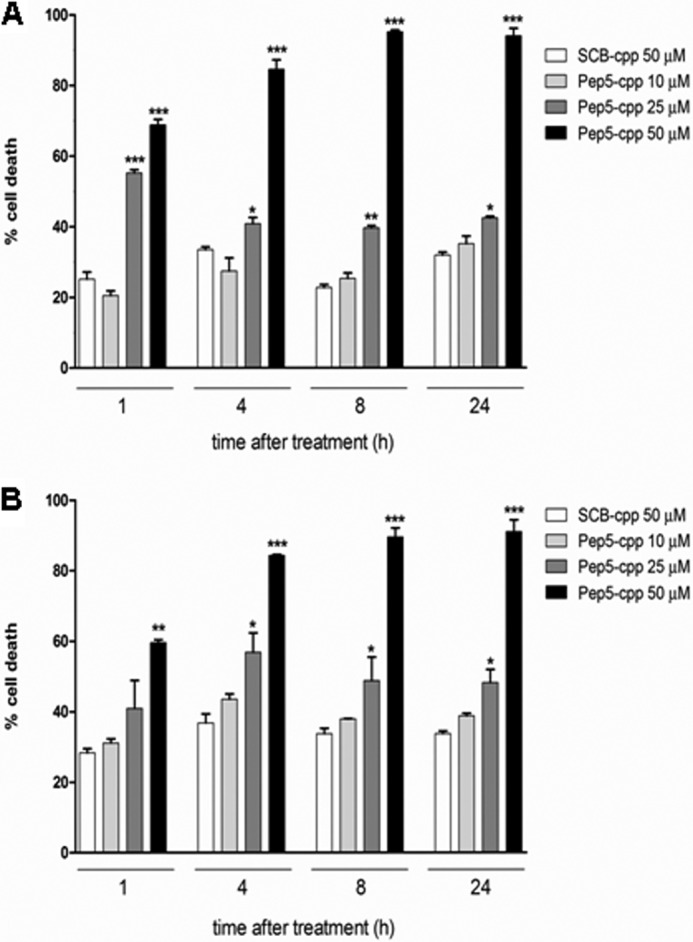
Dose-response and time course of the cell death activity of pep5-cpp in MDA-MB-231 and MCF-7 tumor cell lines. The MDA-MB-231 (A) or MCF-7 (B) cells were treated with pep5-cpp (1–50 μm) for different times (1–24 h). NT, not treated. The data shown here are representative of three experiments performed in triplicate, and the results were considered significant when p was <0.001 (***). Error bars, S.E.