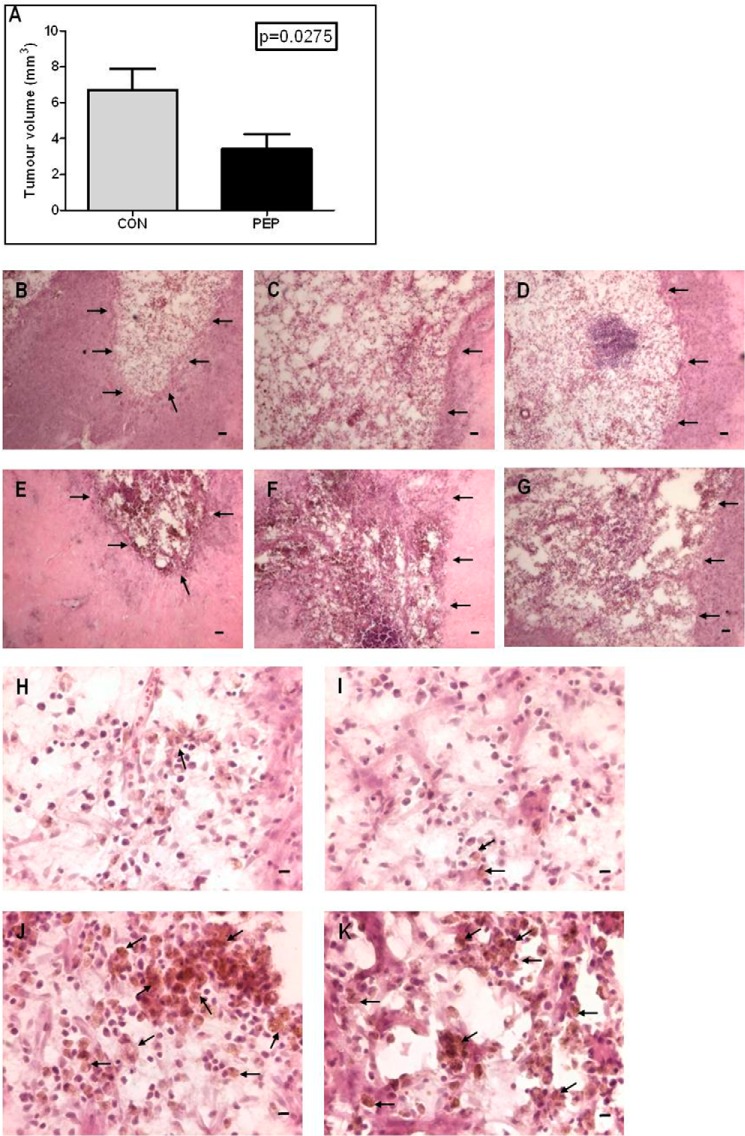
FIGURE 9.
In vivo effects of ΔN-pep5-cpp or pep5-cpp in the rat C6 glioma. Male Wistar rats (n = 5) with 14-day pre-established tumors were treated with ΔN-pep5-cpp or pep5-cpp (100 μm) for an additional 14 days, and after infusion, the animals were killed with an overdose of ketamine-xylazine (Parke-Davis). After perfusion, the brains were removed, fixed in 4% formaldehyde, and cryoprotected with 30% sucrose in PBS. The frozen tissue sections (30 μm) were obtained on a freezing microtome. The brain slices were stained with H&E, and tumor area was analyzed under a microscope. The largest areas of tumor were measured using image analysis software (Image ProPlus). The volume was calculated using the formula, V = π/6 × L × W × H. A, tumor volume. B–D, H, and I, ΔN-pep5-cpp. E–G, J, and K, pep5-cpp. B–G, arrows indicate tumor borders; scale bar, 400 μm. J and K, arrows indicate phagocytic macrophage-like cells. Scale bar (H–K), 20 μm. Analysis was done using the one-tailed t test, and the results were considered significantly different (p = 0.0275). Error bars, S.E.

