FIGURE 2.

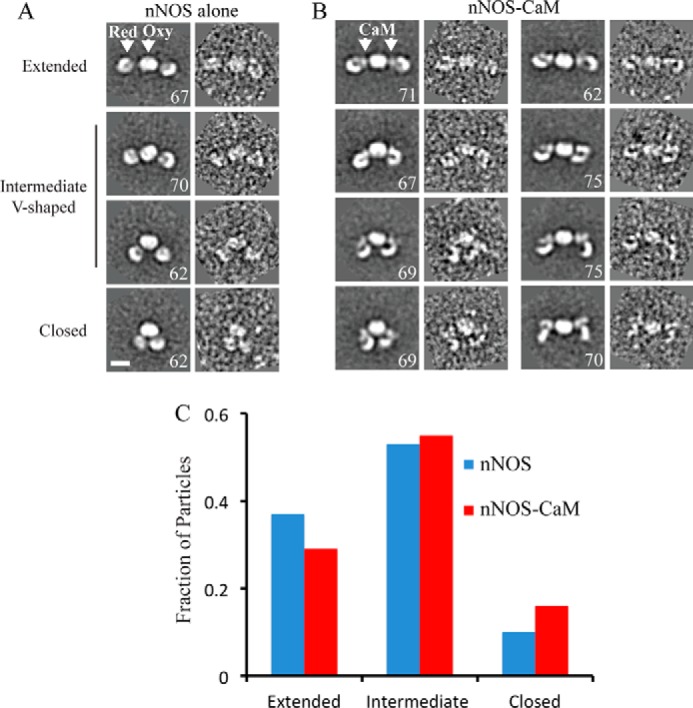
Comparison of the conformational states of nNOS and nNOS-CaM by EM. A and B, representative averages and single particle images from each class, highlighting an extended-to-closed conformational change for the nNOS dimer (A) and nNOS-CaM (B, left panel), with the indicated location of the reductase domain (Red), oxygenase dimer (Oxy), and CaM. B, right panel, representative averages and single particles of nNOS-CaM are shown highlighting conformational changes in the reductase domain. The number of single particle images for each average is shown (scale bar = 100 Å). C, bar graph showing the fraction of nNOS and nNOS-CaM single particles that adopt extended, intermediate V-shaped, or closed conformations, based on the arrangements identified in the two-dimensional averages.
