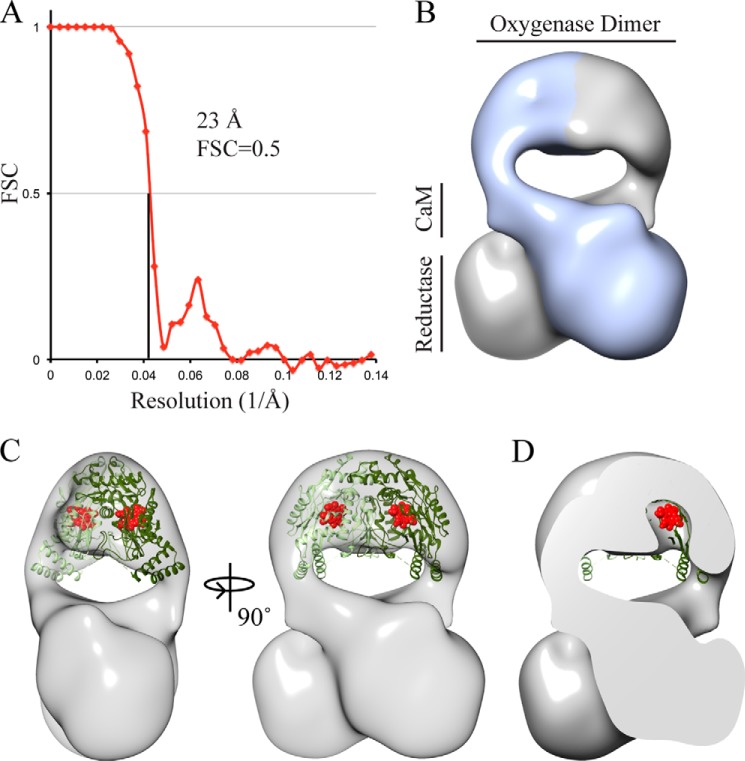
FIGURE 6.
Final three-dimensional model of the cross-linked nNOS-CaM complex. A, gold standard Fourier shell correlation (FSC) curve of the final round of refinement showing a 23 Å resolution at a Fourier shell correlation = 0.5 criterion. B, three-dimensional model of nNOS-CaM, colored along the two-fold axis to show the monomer arrangement. C, the oxygenase dimer (Protein Data Bank (PDB) ID: 1RS9) docked into the EM map and locally optimized using Chimera. The heme cofactors are shown in red. D, cross-section view showing a pocket in the EM model that matches the location of the heme cofactor.

