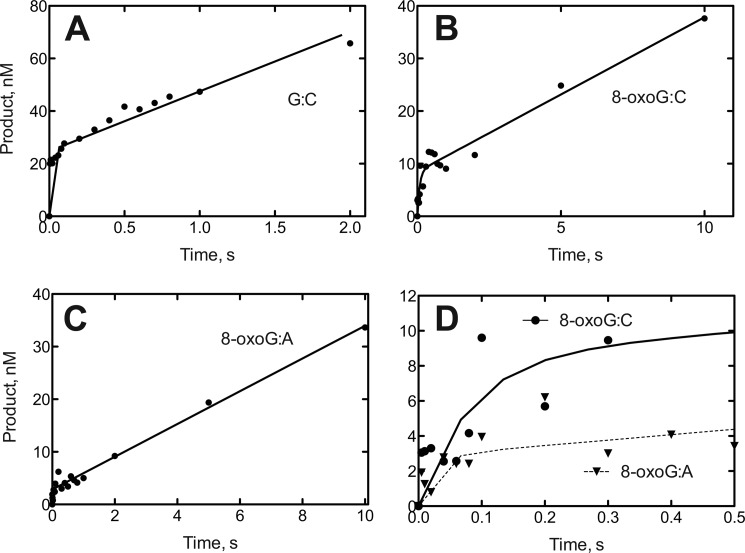
FIGURE 2.
Pre-steady-state kinetic analysis of dNTP incorporation by hpol η. A, template G and incoming dCTP. B, template 8-oxoG and incoming dCTP. C, template 8-oxoG and incoming dATP. D, expansion of early phases of B (●–●) and C (▾–▾). The template-primer complexes of Fig. 1 were used (500 nm) with 50 nm hpol η, with the same buffer system (37 °C) and 0.5 mm dCTP or dATP, for the indicated times, and quenched by the addition of 500 mm EDTA. Products were analyzed by PAGE and phosphorimaging. Data points are shown as means of duplicate incubations and were fit to the equation y = Aekpt + kss, where kp is the first-order rate for the first catalytic cycle; kss is the steady-state rate, and A is the extent of the product burst (GraphPad Prism).

