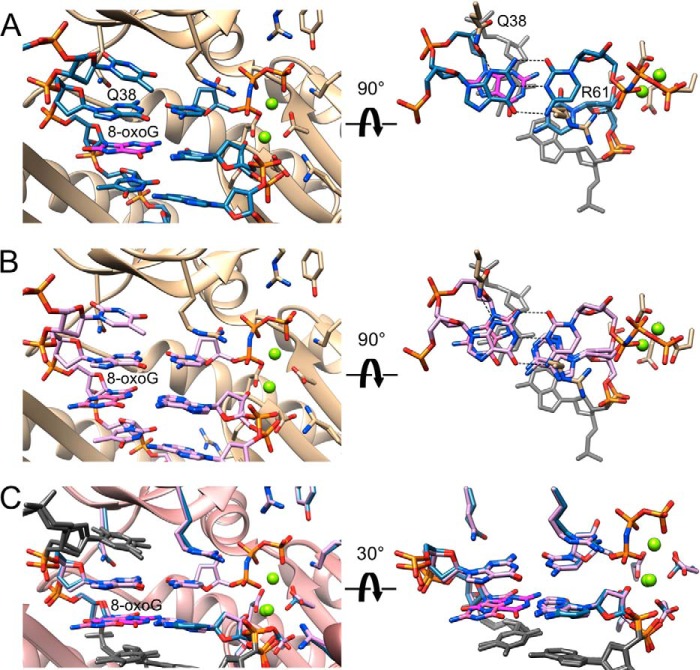
FIGURE 8.
Active site conformations and base pairing configurations in hpol η-DNA-dCMPNPP extension-step complexes. Views into the active sites from the major groove side (panels on the left) and rotated by 90° around the horizontal axis and looking roughly along the normal to the nucleobase plane of the incoming dCMPNPP (right-hand side panels in A and B) and 30° rotation around the horizontal axis in C for two hpol η complexes. Drawing mode and color codes match those in Figs. 6 and 7, i.e. protein backbone and carbon atoms of selected side chains are colored in beige in A and B and in pink (backbone) with side chains matching the coloring of primer C opposite 8-oxoG in the −1 base pair in C. The thymidine residue 5′-adjacent to template dG at the active site and the −2 base pairs are shown in gray on the right and in C. Hydrogen bonds are dashed lines. A, view of the active site with 8-oxoG:dC at the −1 position and template G opposite incoming dCMPNPP. Carbon atoms are light blue except for 8-oxoG carbons that are highlighted in magenta. B, view of the active site with 8-oxoG:dA at the −1 position and template G opposite incoming dCMPNPP. Carbon atoms are lilac except for 8-oxoG carbons that are highlighted in pink. C, superimposition of the two complexes shown in A and B.

