
FIGURE 8.
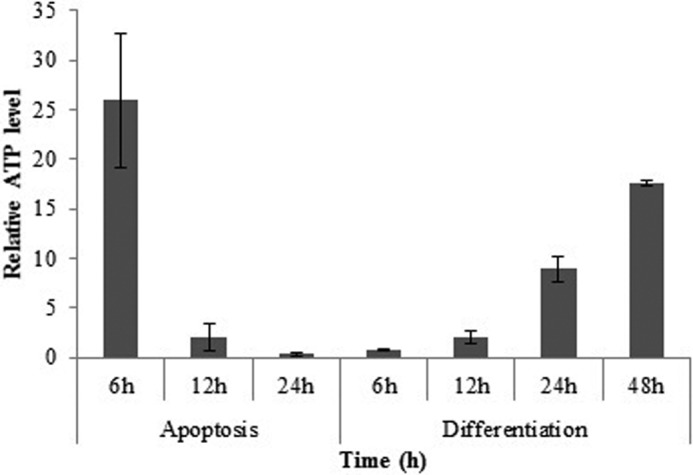
ATP measurement upon induction of apoptosis and differentiation. ATP measurement was performed 6, 12, and 24 h and 6, 12, 24, and 48 h after apoptosis and differentiation induction, respectively. (The data are expressed relative to control). The data are means ± S.D. (error bars) of triplicate experiments.