FIGURE 2.
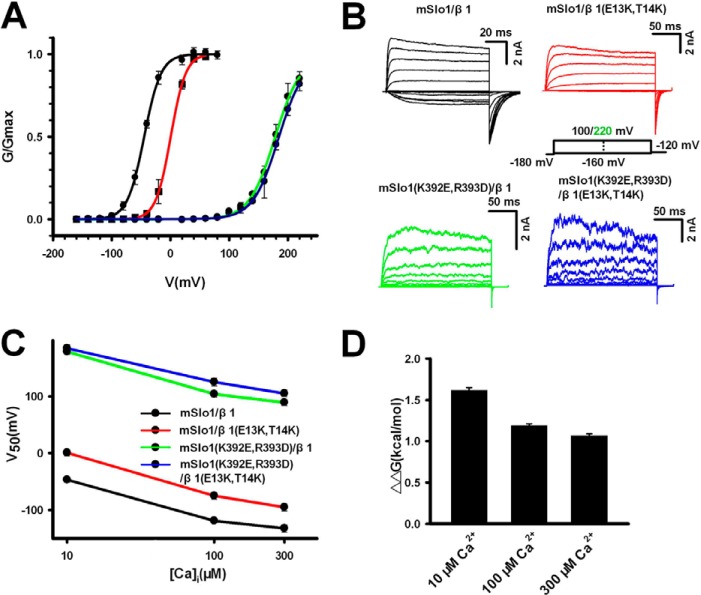
Electrostatic interaction between mSlo1(K392,R393) and β1(E13,T14) determined by double mutant cycle analysis. A, G-V curves were plotted for mSlo1-β1 (V50 = −46.7 ± 4.8 mV, n = 10; black), mSlo1-β1(E13K,T14K) (V50 = 0.7 ± 5.5 mV, n = 9; red), mSlo1(K392E,R393D)-β1 (V50 = 178.3 ± 4.9 mV, n = 7; green), and mSlo1(K392E,R393D)-β1(E13K,T14K) (V50 = 189.0 ± 6.5 mV, n = 6; blue). Solid lines are single Boltzmann functions fitted to each G-V curve. B, representative currents from each experimental combination, recorded from inside-out patches, activated by voltage steps from −160 mV through 100/200 mV in increments of 20 mV, as indicated, after a prepulse of −180 mV, in 10 μm Ca2+. C, the values of V50 were obtained in 10, 100, and 300 μm Ca2+, respectively. D, the ΔΔG values of mSlo1(K392E,R393D) versus β1(E13K,T14K) are 1.62 ± 0.03, 1.17 ± 0.02, and 1.07 ± 0.02 kcal/mol in 10, 100, and 300 μm Ca2+, respectively. Error bars, S.D.

