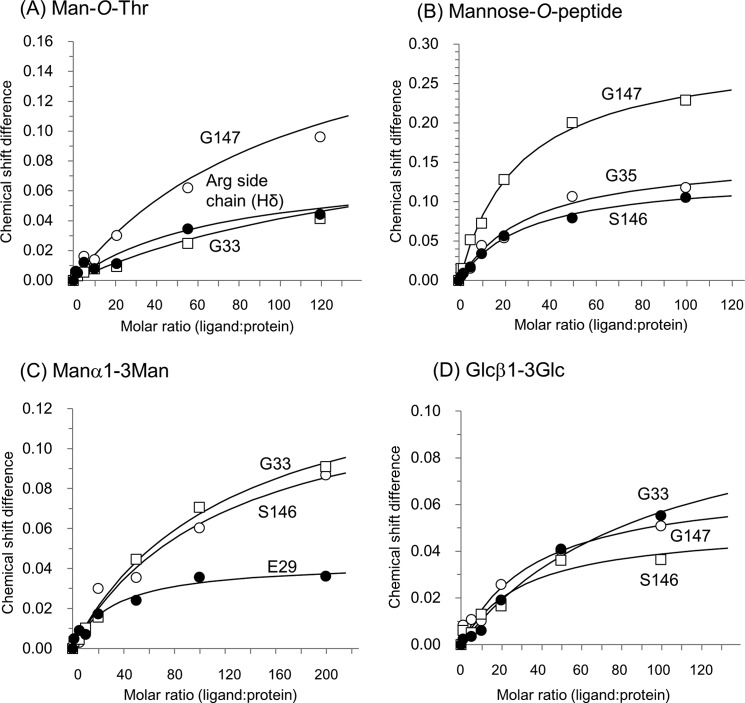
FIGURE 4.
Titration curves for the selected peaks in two-dimensional NMR spectra of 15N-labeled ZG16p. (A) Man-O-Thr, (B) Man-O-peptide, (C) Manα1–3Man, and (D) Glcβ1–3Glc are shown. The corresponding 1H-15N HSQC spectra are shown in supplemental Fig. S1.

