
FIGURE 4.
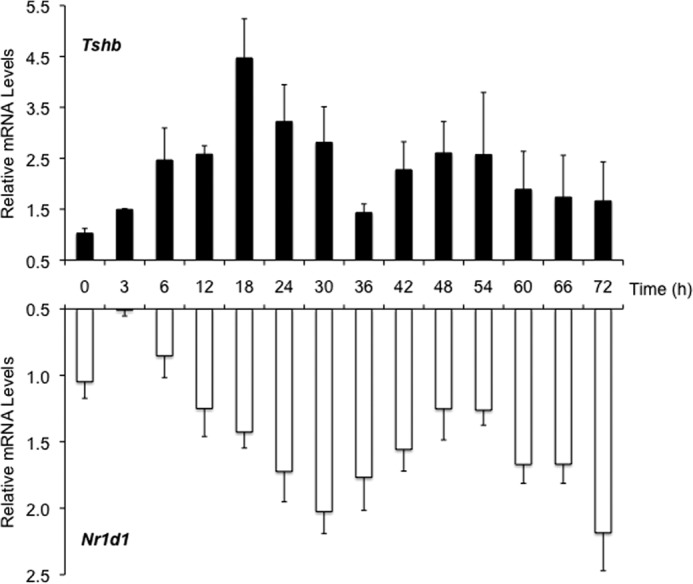
Tshb and Nr1d1 mRNA levels oscillate in TαT1.1 cells. TαT1.1 cells were synchronized by serum shock and harvested at the indicated times for total RNA. RT-qPCR was performed for Nr1d1 (Rev-Erbα) and Tshb mRNA (n = 4). Results are expressed as relative mRNA levels ± S.E. compared with initial levels at time = 0 h.