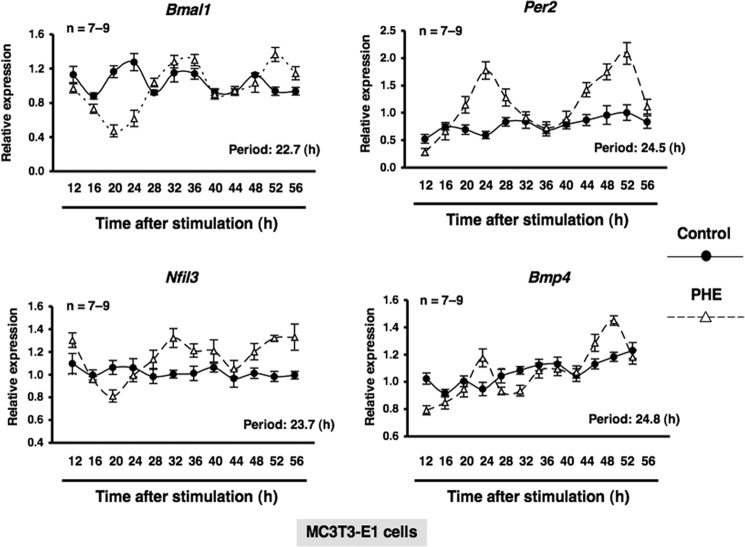
FIGURE 4.
α1-AR signaling mediated circadian rhythmicity in MC3T3-E1 cells. Expression profiles of the Bmal1 (upper left), Per2 (upper right), Nfil3 (lower left), and Bmp4 (lower right) transcript generated by PHE in MC3T3-E1 osteoblastic cells. Total RNA samples were collected at the indicated times after PHE treatment. qRT-PCR analyses of transcript levels were performed using their specific primers. Gapdh was used as an internal control. Each value represents the mean ± S.E. (n = 7–9 independent experiments). *, p < 0.05, significantly different from each control value. The Cosinor analysis method was used to determine the rhythmic expression. The lines show the fitting curves.

