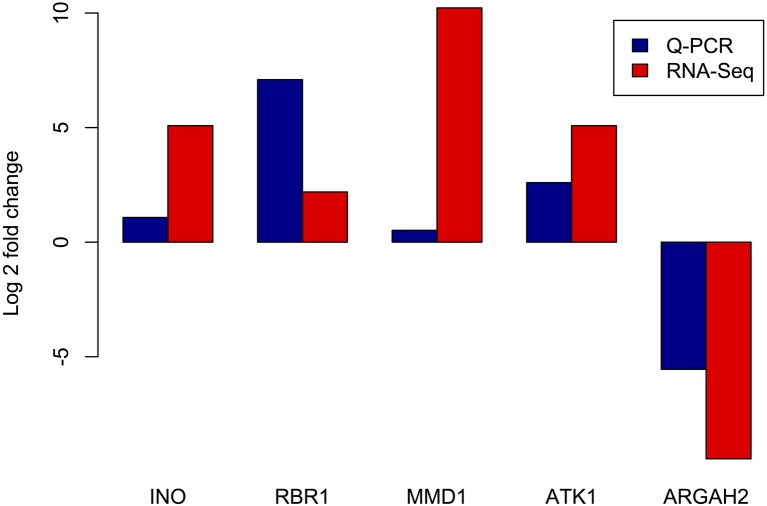
Figure 6.
Comparison of expression levels of selected genes estimated by RNA-seq and RT Q-PCR. X axis: tested genes, INO - “INNER NO OUTER” transcription factor, RBR1 - RETINOBLASTOMA RELATED1, MMD1 - MALE MEIOCYTE DEATH1, ATK1 - ARABIDOPSIS THALIANA KINESIN1, and ARGAH2 - ARGININE AMIDOHYDROLASE2. Y axis - log2 of estimated fold change between meiocyte and somatic libraries.

