
Figure 3.
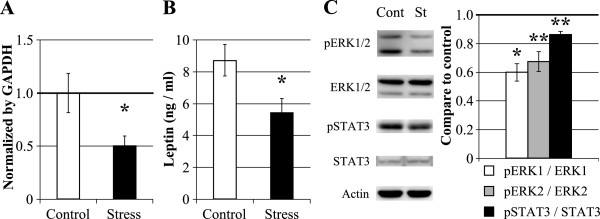
The effects of chronic social defeat stress on leptin and its hypothalamic downstream signals. (A) Evaluation of leptin gene expression using real time PCR analysis in the fat tissue (Control, n = 8; Stress, n = 7). (B) Evaluation of leptin peptide expression in the blood plasma (Control, n = 8; Stress, n = 7). (C) Evaluation of the expression and phosphorylation of STAT3 and ERK1/2 in the hypothalamus using western blot analysis. Each band was normalized to actin levels and compared quantitatively using Image J software. (n = 4 / group). *P < 0.05, **P < 0.01 (Student’s t-test); Cont, Control; St, Stress. Data represent the means ± S.E.M.