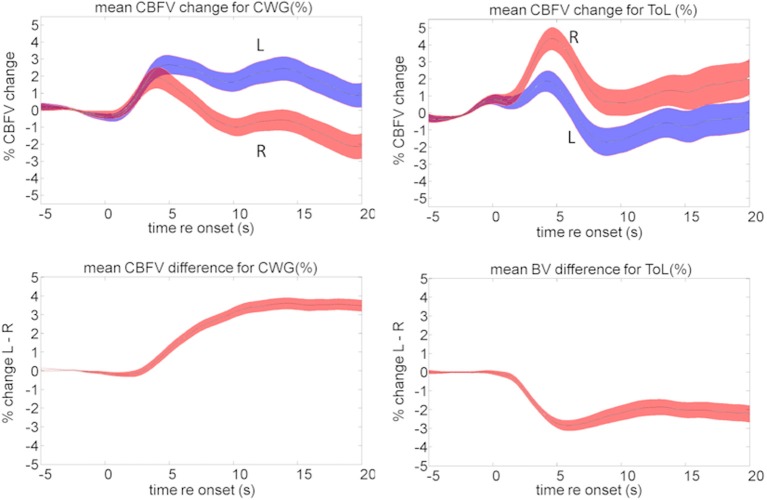
Figure 8.
Mean cerebral blood flow changes (top) and lateralization pattern (bottom) for the cued word generation (CWG, left) and Tower of London (ToL, right) task. The shaded area defines the standard error over all subjects. The average data shown here hide a significant amount of inter-subject variability that forms the basis of further analysis.

