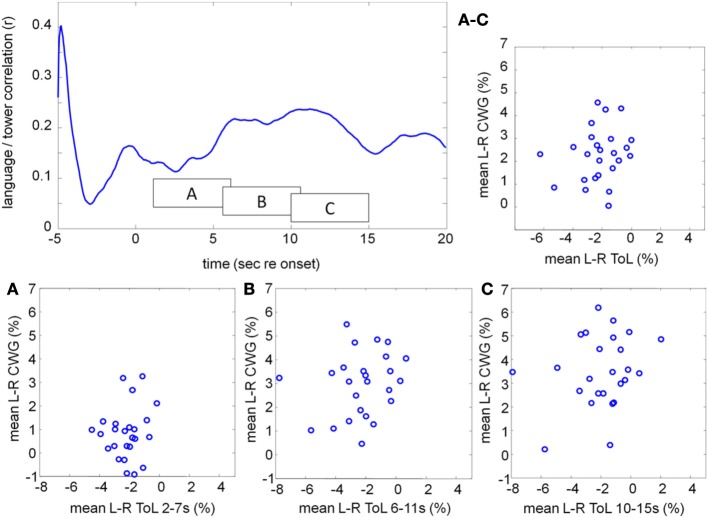
Figure 9.
Correlation between the mean lateralization for CWG and ToL computed across our participant pool using moving windows of 5 s duration (top left). The individual lateralization values for the two tasks are never significantly correlated. The average lateralization data in three windows, starting at 2, 6, and 10 s after task onset are shown in boxes A, B, C. The average lateralization for each subject between 2 and 15 s re task onset is shown on the top right (labeled A–C).

