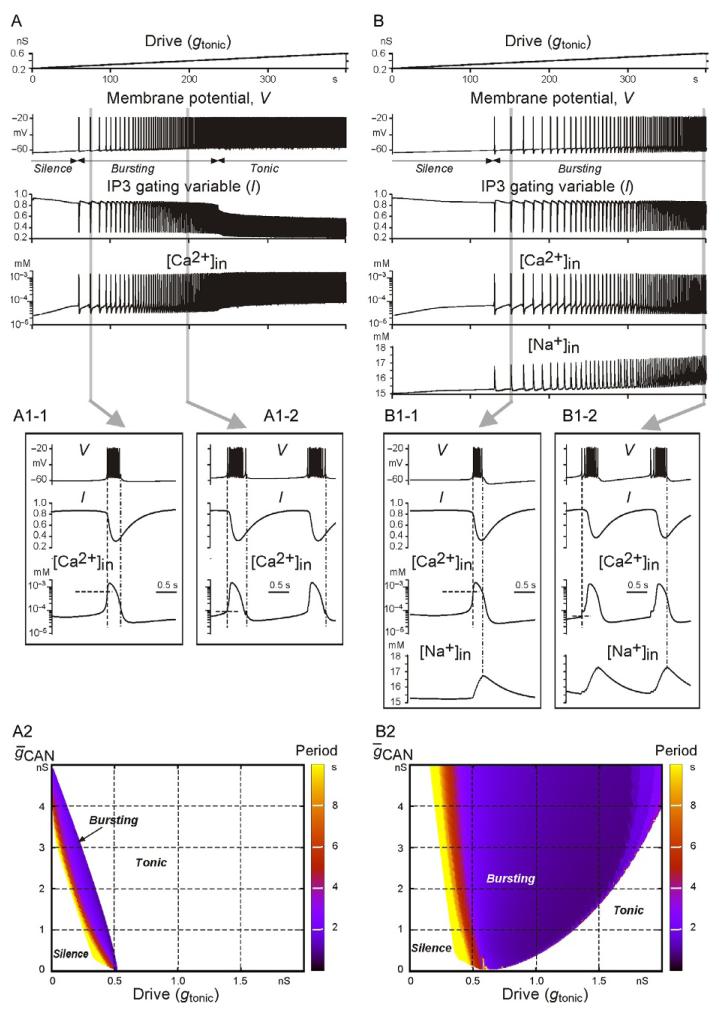
FIGURE 2.
Simulation of an ICa- and ICAN-dependent bursting using two single-neuron models with different burst-terminating mechanisms. In the first model (A), burst termination was based on the Ca2+-dependent IP3 receptor inactivation (see the traces for IP3 receptor gating variable l and [Ca2+]in). In the second model (B), there were two burst-terminatingmechanisms: one based on the Ca2+-dependent IP3 receptor inactivation (as in the first model) and the other based on intracellular Na+ accumulation (see [Na+]in traces) and subsequent activation of the Na+/K+ pump. Each column shows the neuron response to the slow ramp increase of input excitatory synaptic drive (shown at the top). Insets A1-1 and A1-2, and B1-1 and B1-2 (from A and B traces, respectively, highlighted by gray) show the shape of generated bursts and the changes in relevant variables. Panels A2 and B2 show regions of silence, bursting, and tonic activity in the 2D space ḡCAN,gtonic for the models shown in panels A and B, respectively. The bursting period in each plot is indicated by a color/gray level scale bar on the right of each diagram. See text for details.

