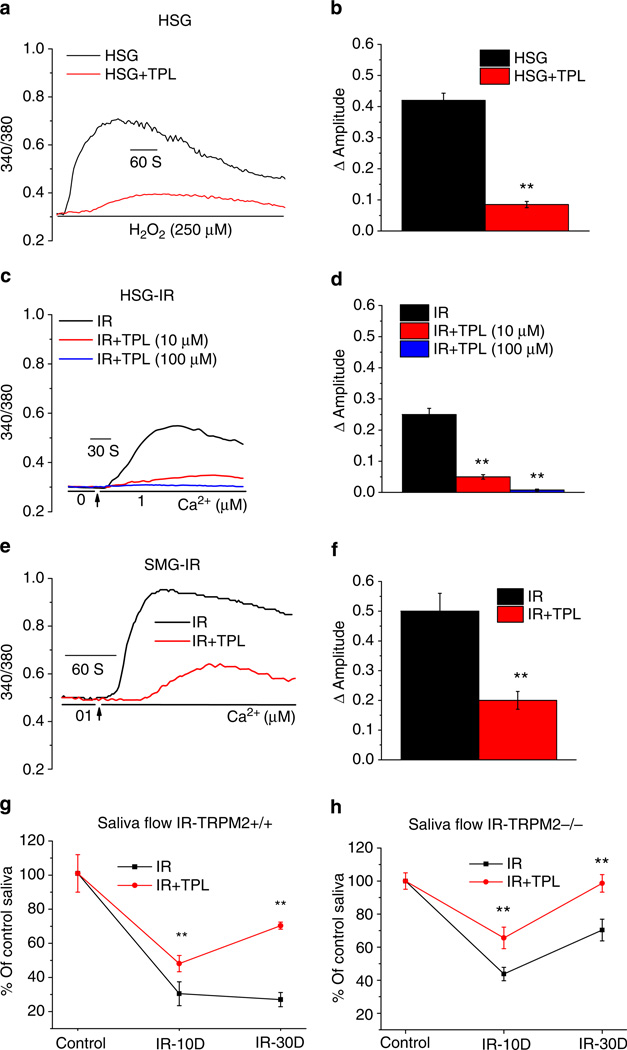
Figure 6. TPL attenuates IR-induced TRPM2 activation and decrease in salivary fluid secretion.
(a) HSG cells were treated with TPL (10, 100 mM for 10 min) before addition of H2O2. Traces show [Ca2+]i changes in control and TPL-treated cells. (b) Average values of experiments shown in a. **Indicates a statistically significant difference (P < 0.01, number of cells tested from 112–123) compared with unmarked value. (c) Cells were treated with two concentrations of TPL as given in a (10, 100 mM) and then subjected to 15 Gy radiation. [Ca2+]i was measured within 1 to 1.5 h after IR in IR-HSG and TPL-treated IR cells (average values are given in d). **Indicates values that are significantly different from the control group (P < 0.01, number of cells tested from 101–114). (e) Constitutive [Ca2+]i increases in acini isolated from submandibular glands that were excised 24 h after 15 Gy IR with or without TPL treatment. Average values are given in f (**indicates values that are significantly different from the control group, P < 0.01 and number of cells tested from 145–175). (g) Mice were treated with TPL 175mgkg−1 body weight, i.p., 10 min before 15Gy-IR. SMG were excised and acini were prepared, loaded with fura2 and used for [Ca2+]i measurements. Traces show representative pattern. (f) Average data from 145–175 cells (from 2–3 mice in each group) are shown. **Indicates values that are significantly different from the control group, P < 0.01). TRPM2+/+ mice (g) or TRPM2−/− mice (h) were treated with TPL (175mg kg−1 body weight, i.p., 10 min before 15Gy-IR) and saliva flow was measured as described above (Fig. 4) on 10 and 30 days after IR. Saliva flow is shown relative to the value obtained before IR (10 animals for TPL-treated group and 29 animals for untreated control, **indicates statistically significant difference, P < 0.01 from corresponding values in untreated mice. All values are defined as mean±s.e. in b,d and f–h.

