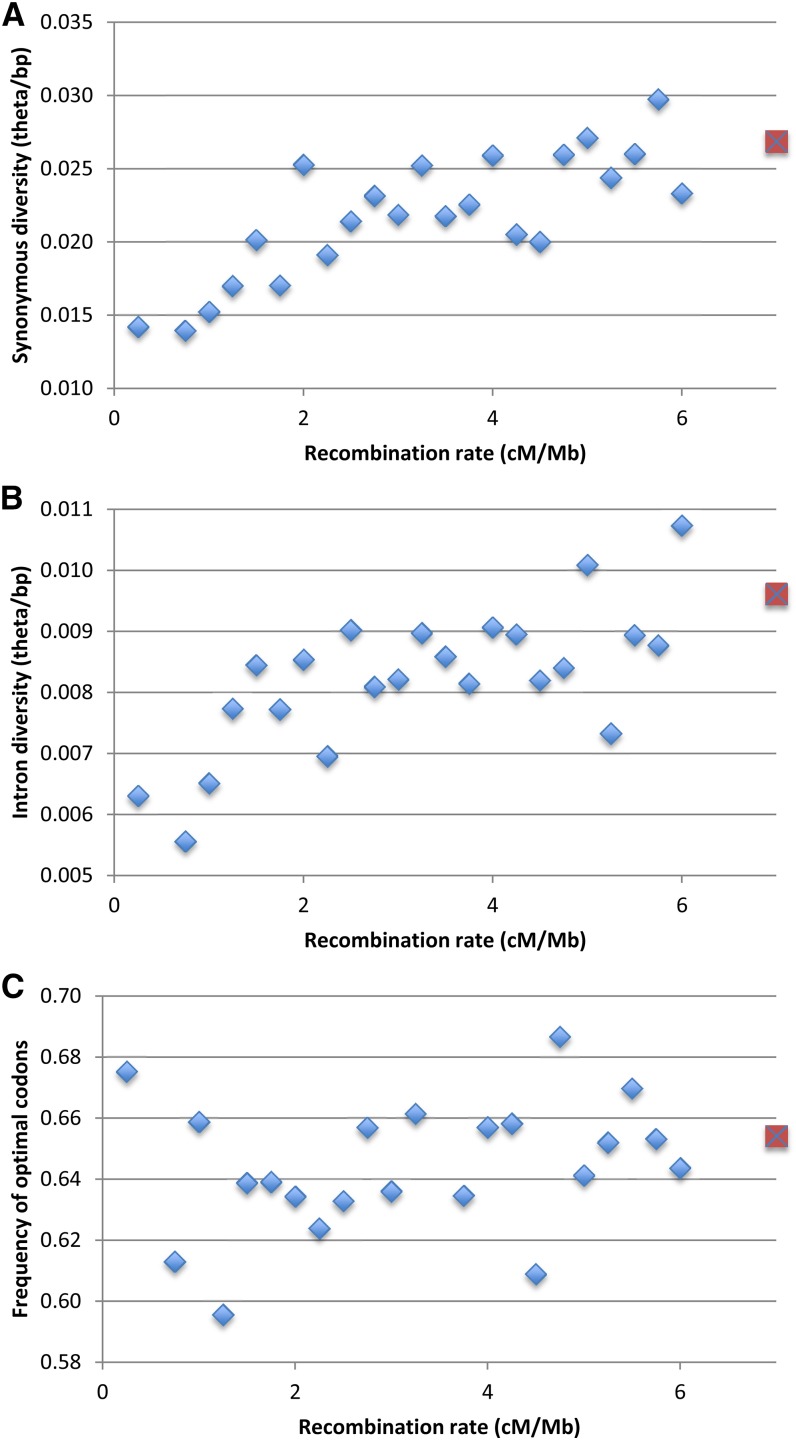
Figure 2.
Diversity and codon bias relative to recombination rate. Points are plotted at the upper end of the recombination rate range (e.g., at 0.25 for 0−0.25 cM/Mb); the red point represents sites in regions with recombination rate above 6 cM/Mb. (A) Synonymous diversity measure is the Watterson (1975) estimator of θ. (B) Intron diversity. (C) Codon bias measure is Fop (Sharp and Devine 1989).

