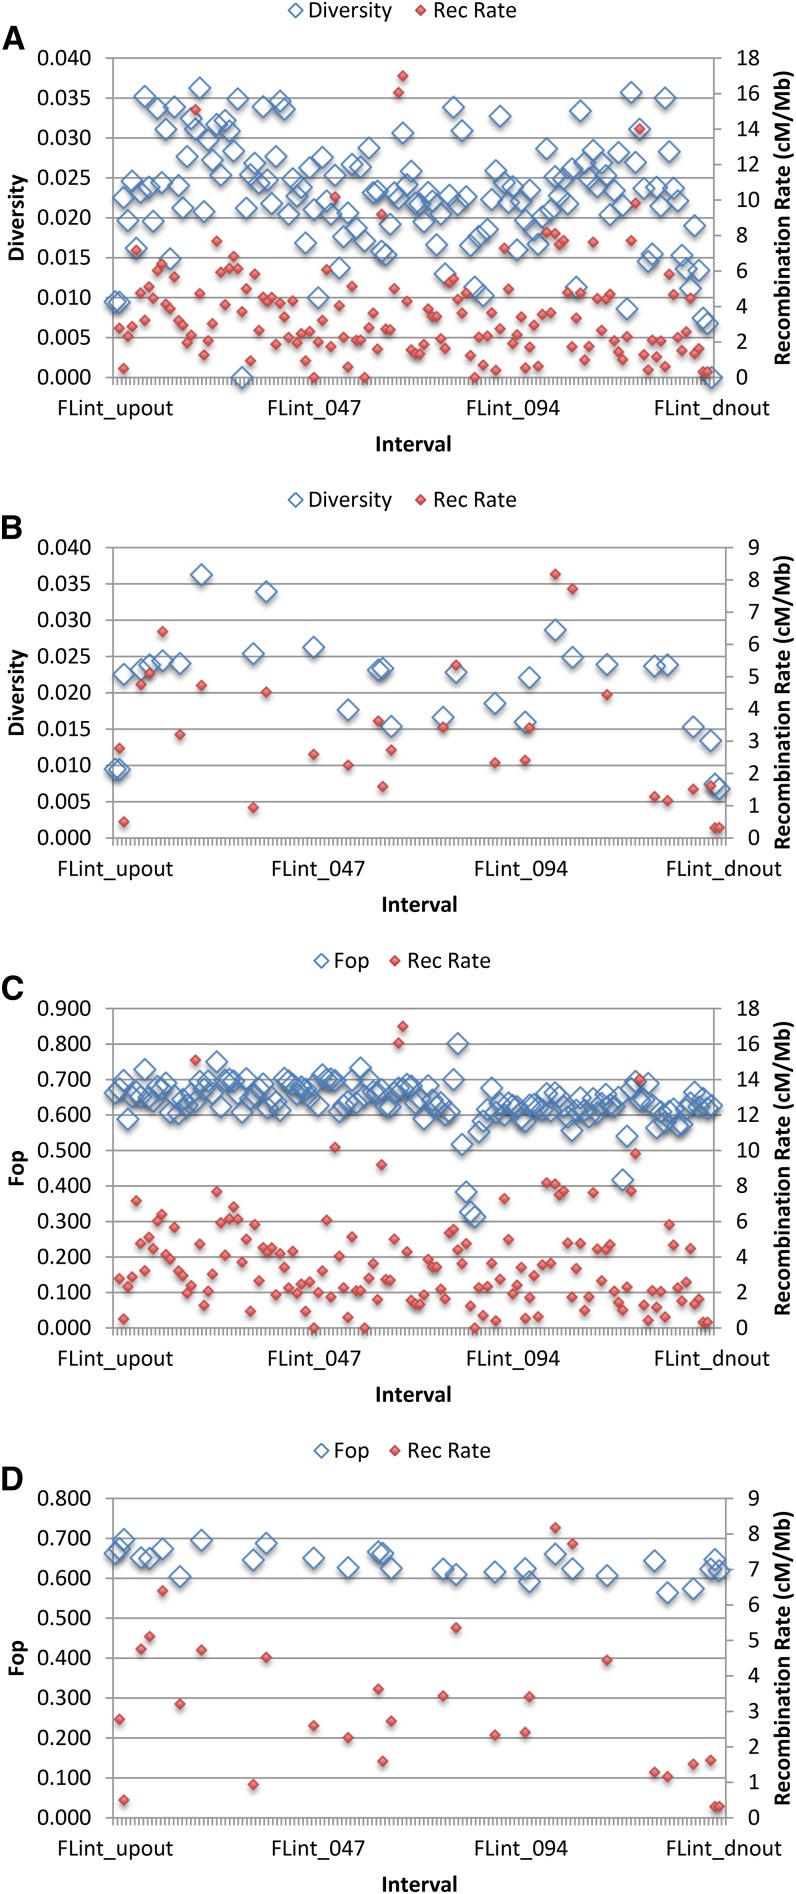
Figure 3.
Diversity and codon bias along Chromosome 2. (A) Diversity in all recombination map segments. Segments upstream (FLint_upout) and downstream (FLint_dnout) of the recombination map are also shown; for these, there is no corresponding recombination rate estimate. (B) Diversity in segments with at least 5000 synonymous sites. (C) Codon bias (Fop) in all segments. (D) Codon bias in segments with at least 5,000 synonymous sites. Recombination rates (cM/Mb from the Flagstaff testcross) are shown for reference.

