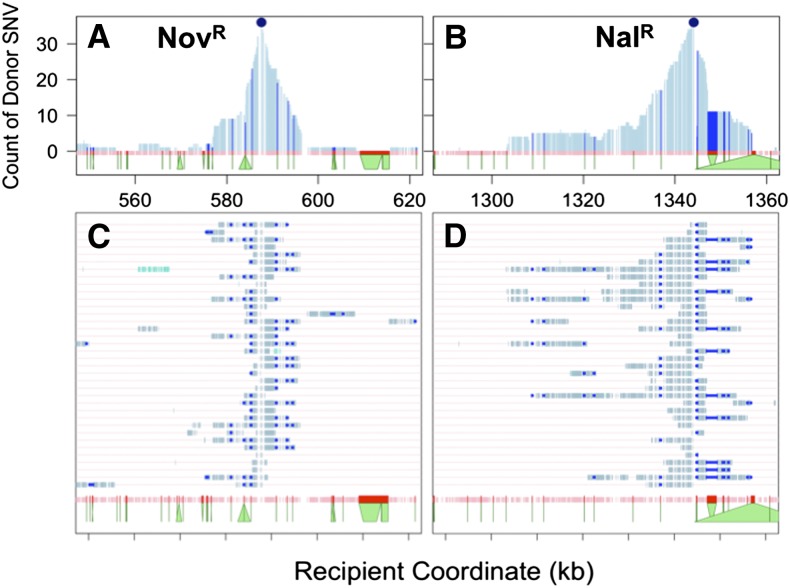
Figure 5.
Cotransformation around selected sites. (A) and (B) show zooms around the NovR and NalR selected sites for NovR and NalR clones, respectively, whereas (C) and (D) draw the genotype for each specific clone. Donor SNVs are shown in light blue, whereas donor SVs are shown in dark blue (following the width of the recipient allele). The bottoms of the green trapezoids along the x-axis show the width of the SVs according to the donor genome. For example, the SV at ~584 kb is a 2.7-kb transposon specific to the donor strain, and the SV at ~1347 kb has 2 kb in the recipient that do not align with 300 bp in the donor. SNV, single-nucleotide variant, SV, structural variant.

