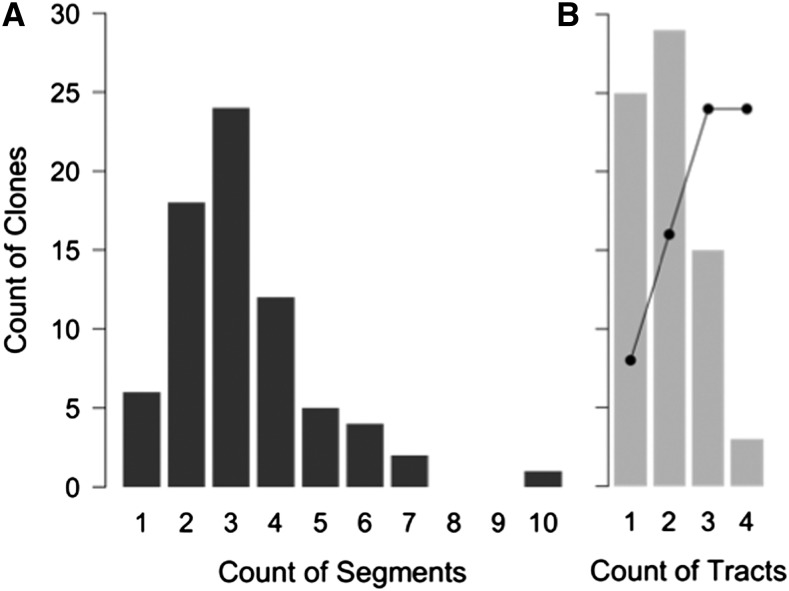
Figure 6.
Estimates of maximal donor segment clustering. Histograms are shown of (A) donor segments detected per clone, (B) minimum “recombination tracts” per clone, defined as sets of adjacent segments falling within 100-kb windows. The black line estimates the number of independent recombination events in the original competent cells, assuming heteroduplex segregation and a maximum of four events.

