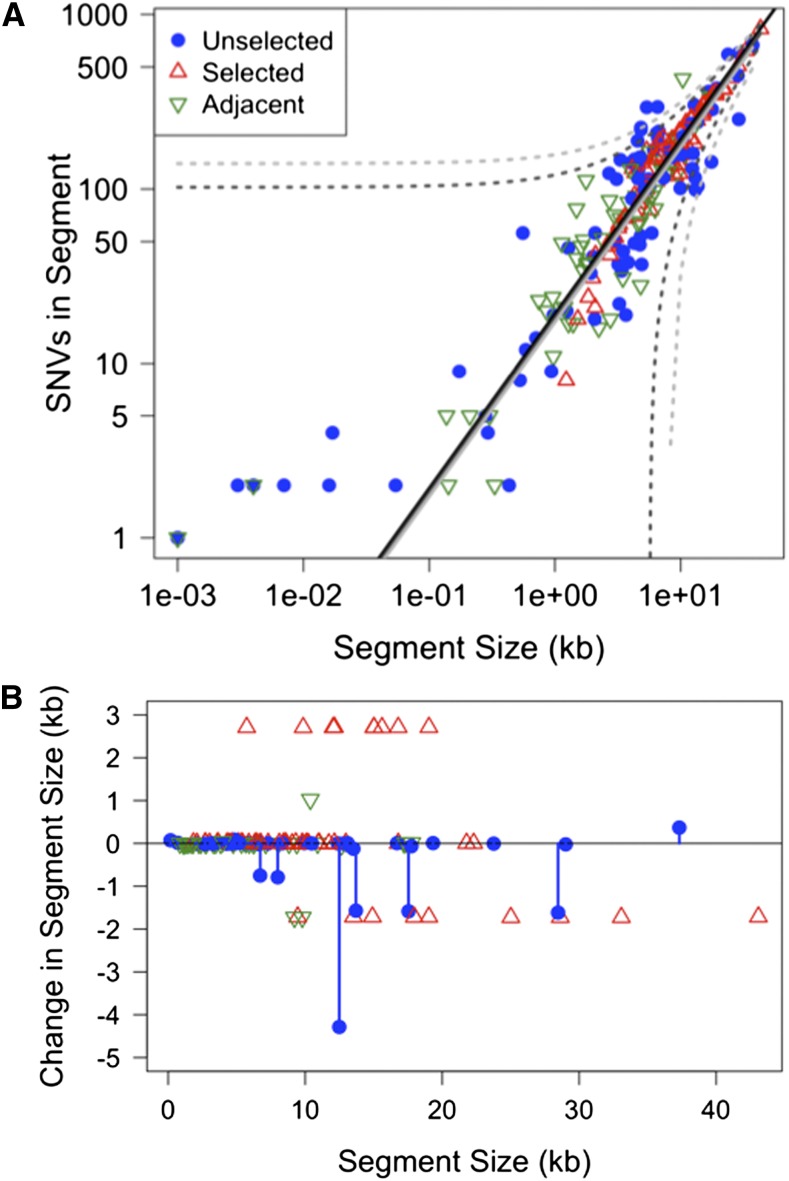
Figure 7.
Effects of sequence divergence. (A) Nucleotide divergence has no observable effect. Plot shows the count of donor SNVs in each segment as a function of segment size. Colored symbols indicates whether the segment spanned either the NovR or NalR selected site (red triangles), was in the same tracts as a selected segment (green triangles), or was considered independent of the selected segment (blue circles). Black line indicates genome-wide average. Solid and dotted lines indicate the linear fit and 95% prediction intervals for all segments (dark gray) and only segments more than 100 kb from the selected site (light gray). (B) Indels/SVs changed length of the recombined segments. The x-axis shows length of recipient sequences replaced by each donor segment, while the y-axis shows the change in length between the recipient and donor segments. Color-coding as in (A), with blue lines to highlight unselected segments. The recurrent 2.4-kb insertion and 1.7-kb deletion correspond to the SVs adjacent to the NovR and NalR sites, as described in the example in Figure 5.

